Understanding Three Outside Down Candlestick Patterns
តើអ្វីទៅជា Three Outside Down Candlestick Pattern?
និយមន័យDefinition
Three Outside Down ជាទម្រង់ទានចុះដែលផ្តល់សញ្ញាប្រាប់យើងថានឹងមានឱកាសវិលត្រឡប់នៅក្នុងលំហូរឡើង ហើយប្រាប់យើងថាកម្លាំងអ្នកលក់កំពុងមានការកើនឡើង។ វាតែងតែកើតឡើងក្នុងលក្ខណៈទាន៣នៅលើក្រាហ្វ។
រូបរាងAppearance
លក្ខណៈសម្គាល់Features
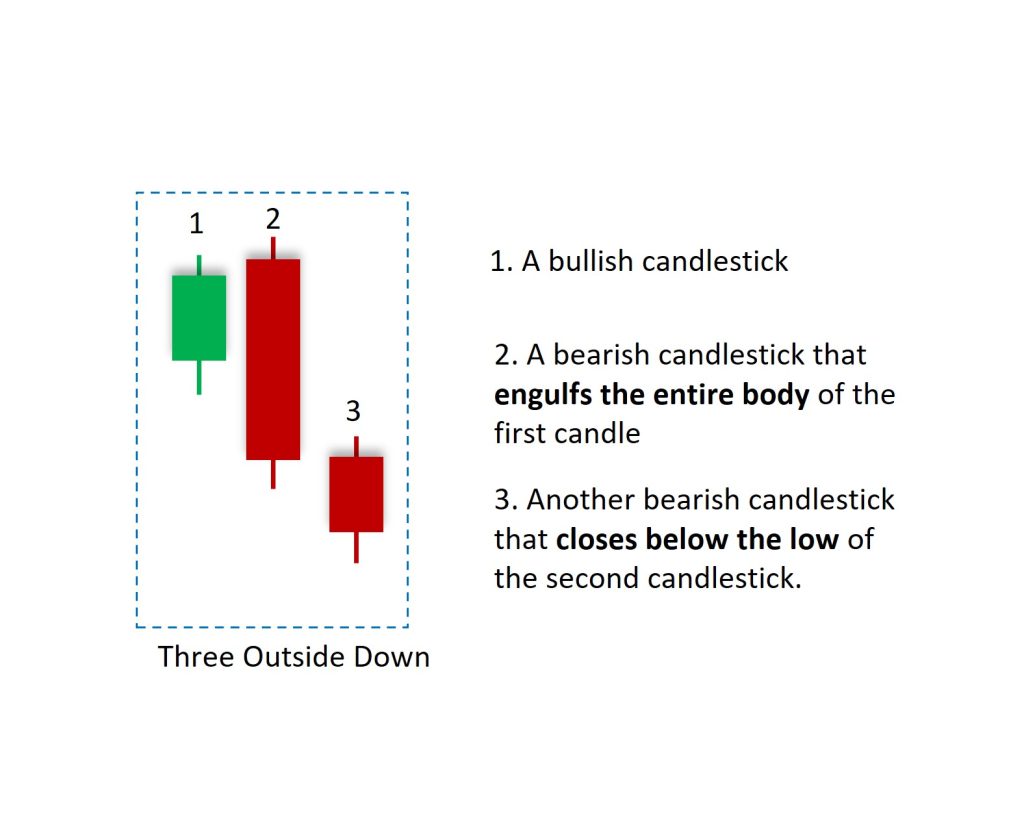
- ទានទី១ : ជាទានឡើងដែលបន្តឡើងស្របលំហូរចាស់។
Donation 1 : An upward trend that continues to go up in line with the old flow. - ទានទី២ : ជាទានចុះដែល គ្របដណ្តប់ទាំងស្រុងលើទានទី១ បង្ហាញពីភាពដែលអាចទៅរួចនៃការវិលត្រឡប់ចុះ។
Verse 2 : A descending verse that completely covers the first verse, indicating the possibility of a downward return. - ទានទី៣ : ទានចុះមួយទៀតដែលបិទក្រោមចំណុចទាបបំផុតនៃទានទី២បញ្ជាក់ប្រាប់យើងថាជាការវិលត្រឡប់ចុះ។
Verse 3 : Another verse that closes below the lowest point of the second verse tells us that it is a reversal.
ឩទាហរណ៍Example
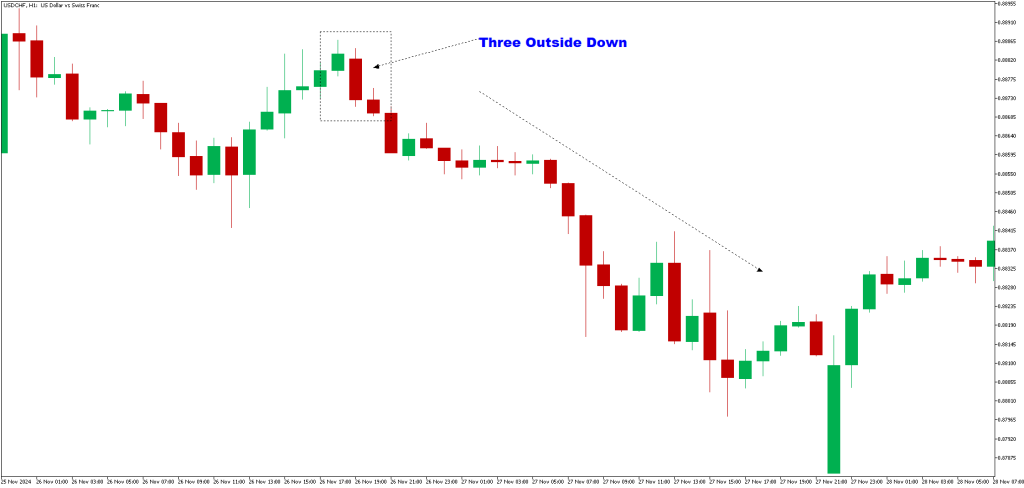
ទម្រង់ទានThree-Outside-Down កើតឡើងនៅពេលដែលទីផ្សារកំពុងមានការកើនឡើងបន្ទាប់មកក៏មានការផ្លាស់ប្តូទិសដៅព្រោះតែមានការកើនឡើងសម្ពាធអ្នកលក់ចូលមកក្នុងទីផ្សារ។ ទានដំបូងជាទានខៀវដែលបង្ហាញពីលំហូរកំពុងឡើង ហើយទានបន្តបន្ទាប់ប្រាប់ថាអ្នកទិញអស់កម្លាំងហើយអ្នកលក់ចូលមកគ្រប់គ្រងទីផ្សារដែលប្រាប់យើងថាអាចនឹងមានការប្តូទិសដៅ។
ការសិក្សារមួយធ្វើឡើងនៅដេប៉ាតេម៉ងហិរញ្ញវត្ថុ នៅសកលវិទ្យាល័យ Illinois បានដាក់ផ្សាយក្រោមប្រធានបទ “Candlestick Patterns and Market Reversals: Empirical Evidence ” បានបង្ហាញថា Three-Outside-Down មានអត្រាជោគជ័យ67%ក្នុងការព្យាករណ៍ថានឹងមានការប្តូរទិសពីឡើងមកចុះវិញ។
English Version
What is Three Outside Down candlestick Pattern?
Definition
The Three Outside Down is a bearish candlestick pattern that indicates a potential reversal in an uptrend, signaling increasing selling pressure.
Appearance
Characteristics
- First Candle: A bullish candlestick that continues the prior uptrend.
- Second Candle: A bearish candlestick that engulfs the entire body of the first candle, signaling a shift in momentum.
- Third Candle: Another bearish candlestick that closes below the low of the second candlestick, confirming the downward momentum.
Example
The three-outside-down pattern occurs when the market is rising and then abruptly changes direction because of rising selling pressure. The initial bullish candle signifies the ongoing uptrend, while the following second and third candles show that the bulls are losing their grip on the market, allowing the bears to dominate, which suggests a possible reversal.
A study from the Department of Finance at the University of Illinois, featured in a research paper named “Candlestick Patterns and Market Reversals: Empirical Evidence,” indicates that the Three-Outside-Down pattern has a success rate of around 67% for forecasting bearish reversals.