Understanding Bullish Harami Candlestick Patterns
តើអ្វីទៅជា Bullish Harami Candlestick Pattern?
និយមន័យ
Bullish Harami Patternបង្ហាញពីភាពមិនប្រាកដរបស់អ្នកចូលរួមក្នុងទីផ្សារ។ វាក៏បង្ហាញថាសម្ពាធលក់កំពុងធ្លាក់ចុះ ហើយអ្នកទិញកំពុងចូលមកគ្រប់គ្រងក្នុងទីផ្សារ។
រូបរាង
លក្ខណៈសម្គាល់
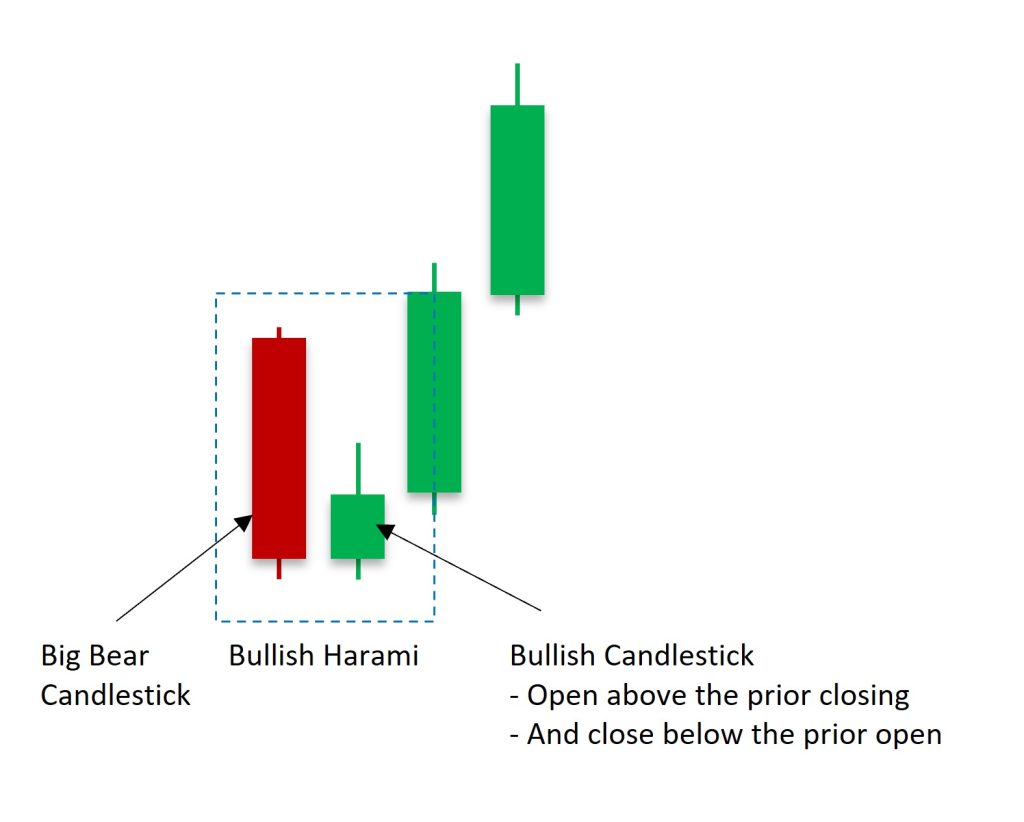
ទម្រង់ទាន Bullish Harami ផ្ទុកទៅដោយទាន២។ វាត្រូវបានសម្គាល់ដោយទានដែលមានតួរខ្លួនតូចមួយកើតឡើងនៅក្នុងចន្លោះនៃតួខ្លួនរបស់ទានធំមួយ។ ទម្រង់នេះតែងតែកើតឡើងនៅខាងចុងនៃលំហូរចុះ ដែលផ្តល់សញ្ញាប្រាប់យើងថាអាចនឹងមានការប្តូរទិសដៅរពីចុះមកឡើងវិញ។
ឩទាហរណ៍
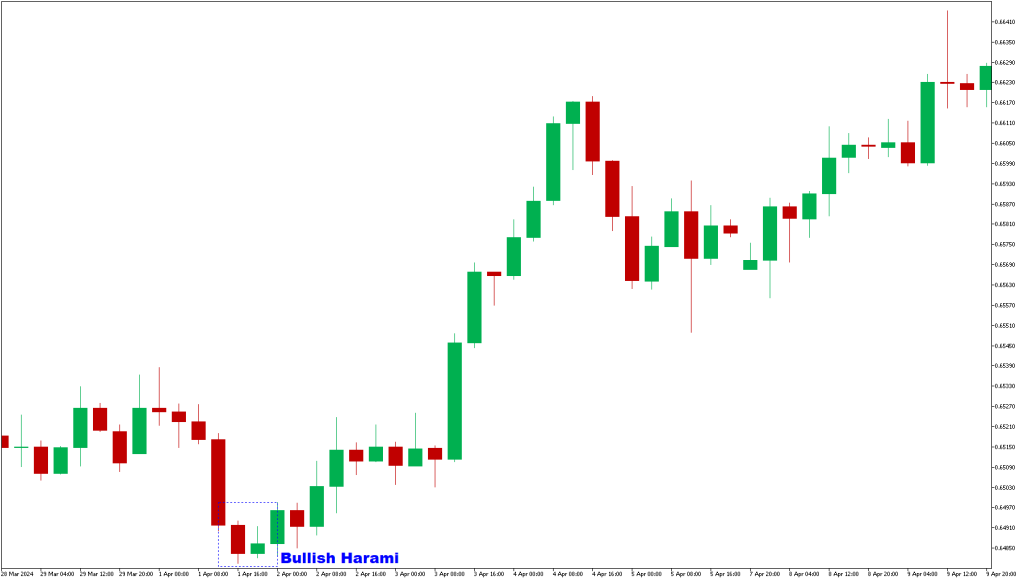
នៅក្នុងការសិក្សាមួយក្រោមប្រធានបទ“Encyclopaedia of Candlestick Charts” ធ្វើឡើងដោយលោក N. Bulkowski បានរកឃើញថាទម្រង់ទាន Bullish Harami មានអត្រាជោគជ័យរហូតដល់ទៅ 54% នៅក្នុងការព្យាករណ៍ពីការផ្លាស់ប្តូរលំហូរ។ តួរលេខនេះគឺយោងទៅតាមការវិភាគនិងតេស្តសាកល្បងទៅលើប្រវត្តិតម្លៃ ដែលវាបានចង្អុលបង្ហាញថារាល់ពេលដែល Bullish Harami កើតឡើងវាតែងតែផ្តល់សញ្ញាប្រាប់យើងថានឹងមានការវិលត្រឡប់កើតឡើង។
English Version
What is Bullish Harami candlestick Pattern?
Definition
The Bullish Harami Pattern reflects uncertainty among market participants. It also signals a decline in selling pressure, with buyers gradually gaining control of the market.
Appearance
Characteristics
The Bullish Harami candlestick pattern consists of two candles. It is defined by a small green-bodied candle forming within the range of a preceding larger red-bodied candle. This pattern typically appears at the bottom of a chart, signaling a possible reversal from a bearish trend to a bullish one.
Example
In his study, “Encyclopaedia of Candlestick Charts”, Thomas N. Bulkowski found that the bullish harami pattern has a success rate of about 54% in predicting market reversals. This figure, based on extensive backtesting and analysis, highlights the bullish harami pattern’s value in technical analysis, as it frequently indicates a potential shift from bearish to bullish market sentiment.