How to Read Forex Charts: A Step-by-Step Guide
យល់ដឹងពីការអានទីផ្សារ Forex គឺមានសារៈសំខាន់សម្រាប់អ្នកជួញដូរ។ ម្យ៉ាងវិញទៀត ប្រសិនបើអ្នកជាអ្នកចាប់ផ្តើមដំបូង ឬក៏កំពុងស្វែងរកការកែលម្អជំនាញរបស់អ្នក ជំនួញនេះនឹងនាំអ្នកទៅកាន់ដំណាក់កាលនៃការអានទីផ្សារ Forex និងការបកស្រាយចលនាដឹកនាំតម្លៃនៃទីផ្សារ។
១.”យល់ដឹងពីមូលដ្ឋាននៃតារាង Forex”
តារាងទីផ្សារ Forex បង្ហាញពីចលនាតម្លៃរបស់គូរូបិយប័ណ្ណក្នុងរយៈពេលកំណត់។ តារាងទាំងនេះបង្ហាញទិន្នន័យប្រវតិ្តនៃទីផ្សារ ដែលអនុញ្ញាតឱ្យអ្នកជួញដូរវិភាគការសម្រេចចិត្តនៃការលក់និងការជួញដូរ។
ប្រភេទតារាងទីផ្សារ Forex ដែលពេញនិយមបំផុតមាន៖
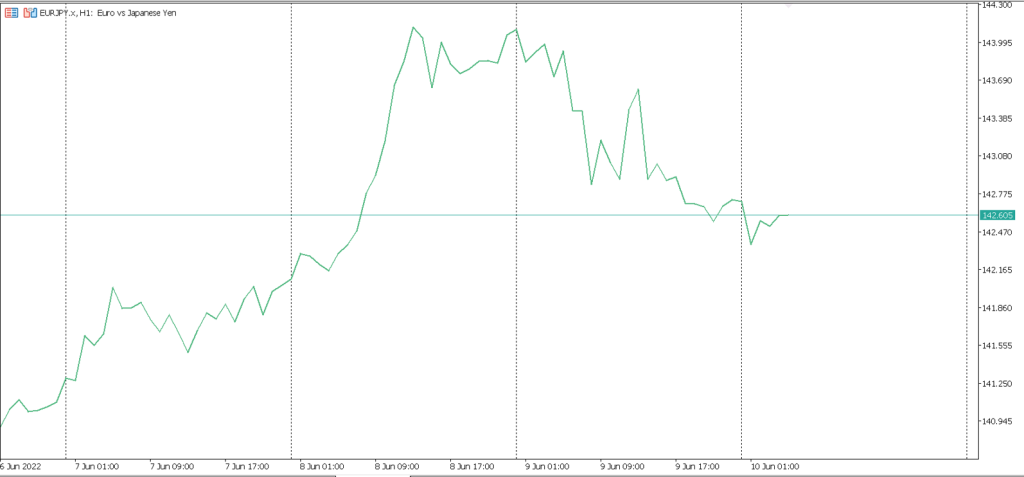
– “តារាងជាបន្ទាត់(line chart)”: តារាងសាមញ្ញបំផុតដែលបង្ហាញតម្លៃបិទនៃការជួញដូរក្នុងរយៈពេលមួយ។
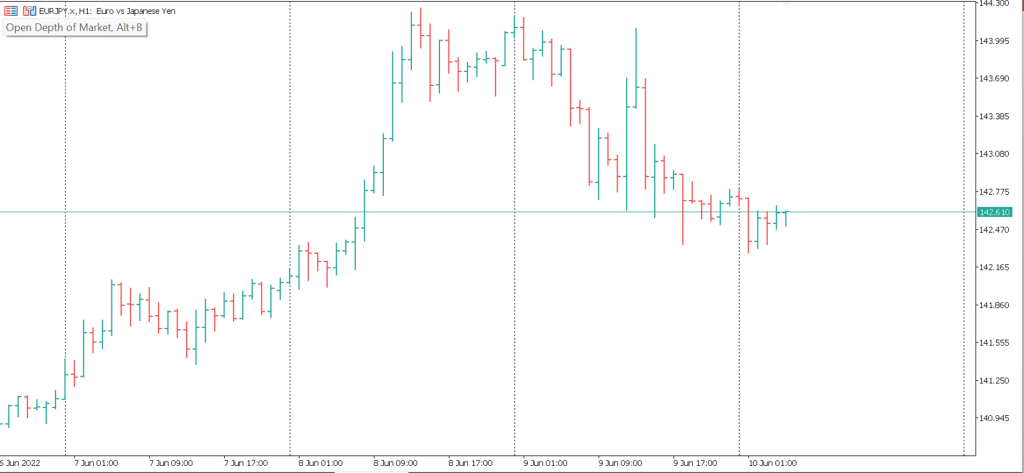
– “តារាងជារបារ(bar chart)”: បង្ហាញពីតម្លៃបើក, ខ្ពស់, ទាប និងបិទសម្រាប់រយៈពេលជាក់លាក់មួយ។វាផ្ដល់ព័ត៌មានលម្អិតជាងline chart
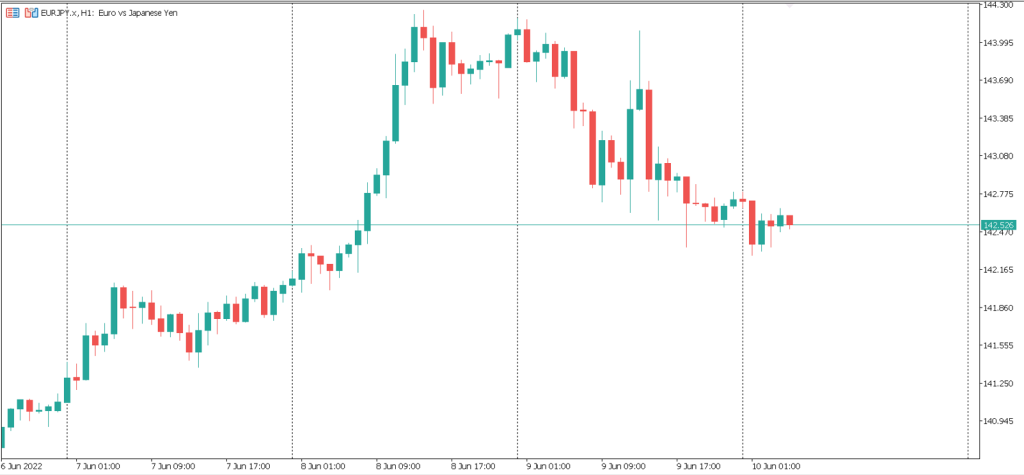
– “តារាងជា Candlestick”: ប្រភេទគំនូសតាងដ៏ពេញនិយមបំផុតក្នុងចំណោមពាណិជ្ជករ វាក៏បង្ហាញទិន្នន័យ OHLC ផងដែរ ប៉ុន្តែជាទម្រង់ទាក់ទាញដែលមើលឃើញជាមួយនឹង “ទាន” ដែលតំណាងឱ្យរយៈពេលនីមួយៗ។
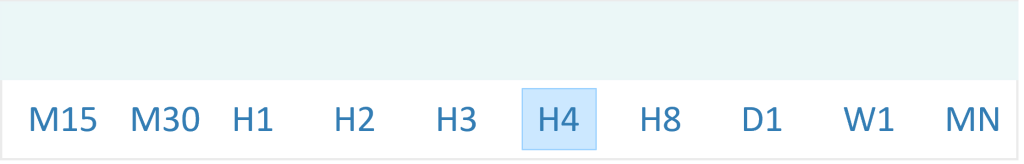
២. “ស្គាល់ពីរយៈពេលនីមួយៗ”
តារាង Forex មានរយៈពេលផ្សេងៗគ្នា ដោយចាប់ពីនាទីទៅខែ។ ជាអ្នកជួញដូរ អ្នកត្រូវតែសម្រេចចិត្តថាតើរយៈពេលណាដែលសាកសមសម្រាប់ស្ទាយការជួញដូររបស់អ្នក។
- 1 នាទី (M1)
- 5នាទី (M5)
- 15 នាទី (M15)
- 30 នាទី (M30)
- 1 ម៉ោង (H1)
- 4 ម៉ោង (H4)
- 1 ថ្ងៃ (Daily)
- 1 សប្ដាហ៍ (W)
- 1 ខែ (Monthly)
៣. “សិក្សាអំពី candlestick pattern”
តារាងcandlestick ត្រូវបានគេចូលចិត្តយ៉ាងខ្លាំងដោយអ្នកជួញដូរពីព្រោះវាផ្តល់ការយល់ឃើញអំពីមូលដ្ឋាននៃអារម្មណ៍ទីផ្សារ។
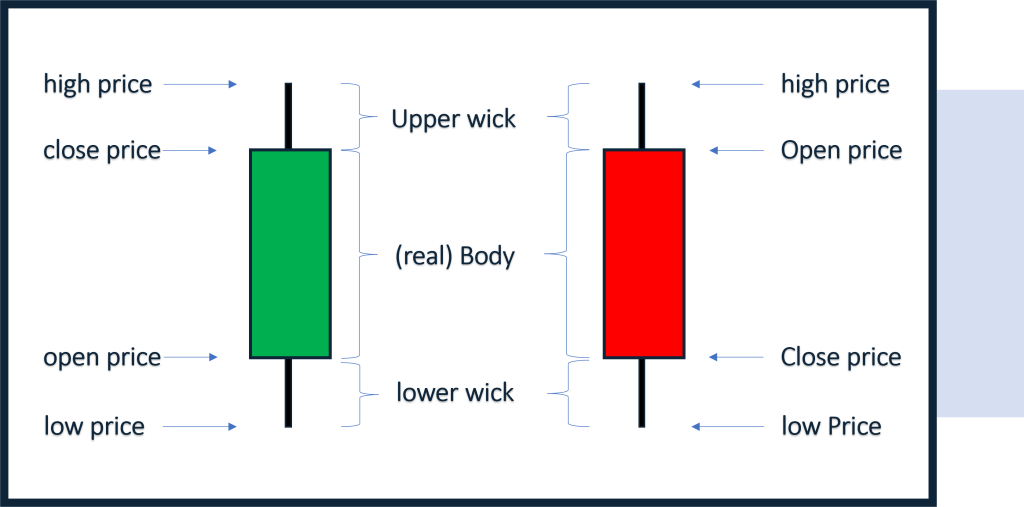
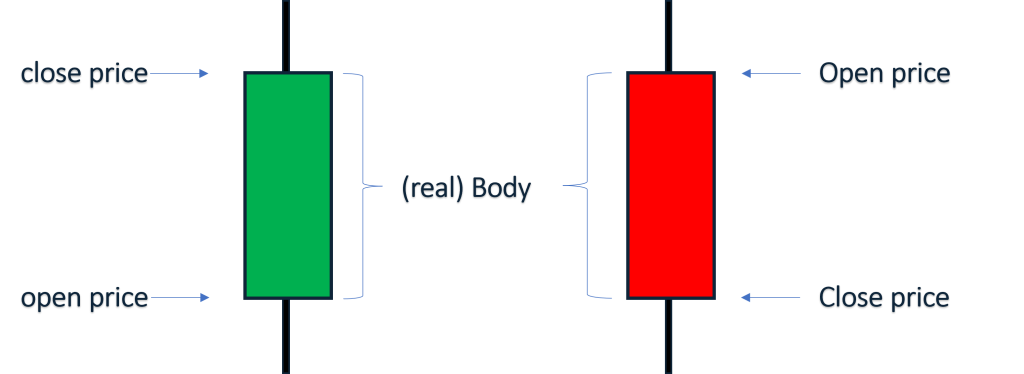
-“តួនៃcandlestick(Body)” ជាផ្នែកដែលធំជាងគេនៃcandlestick ដែលអាចបង្ហាញឲ្យដឹងពីតម្លៃនៃការបិទនឹងបើកនៃការជួញដូរ។
- “ស្រមោលនៃទាន candlestick(shadows)” ជាខ្សែឬស្រមោលមានលក្ខណៈជាបន្ទាត់ដែលនៅពីលើនឹងពីក្រោមBody ដែលបង្ហាញពីតម្លៃដែលខ្ពស់បំផុតនឹងទាបបំផុតនៃការជួរដូរ។
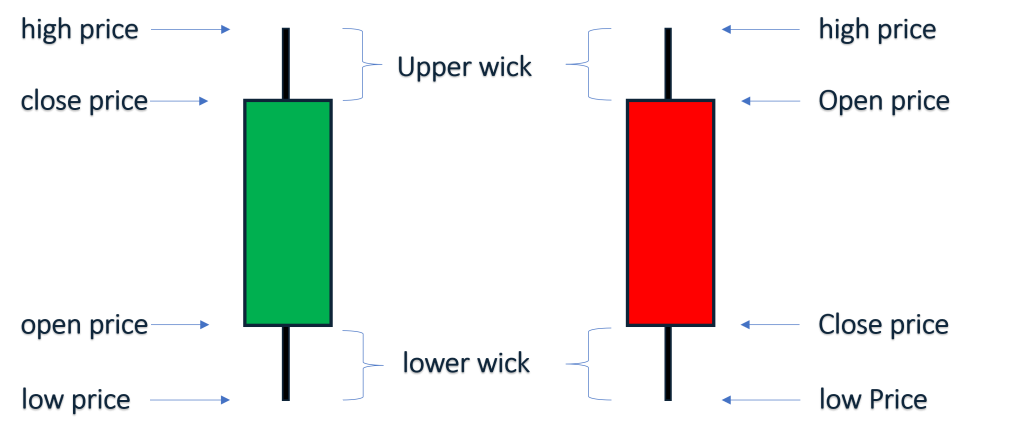
-“បង្គោលឡើង (bullish candlestick)” ជាបង្គោលនៅពេលដែលបិទខ្ពស់ជាងពេលបើកដែលមានបង្គោលពណ៌សឬពណ៌បៃតង។

– “បង្គោលចុះ (bearish candlestick)” ជាបង្គោលនៅពេលដែលបិទទាបជាងពេលបើកដែលមានបង្គោលពណ៌ខ្មៅនឹងពណ៌ក្រហមជាសម្គាល់។ ការសិក្សាពី candlestickនៃទម្រង់រូបរាងវាដូចជា hammer Doji or Engulfing អាចជួយអ្នកក្នុងការមើលទីផ្សារទៅមុខទៀត។

៤. “សម្គាល់កម្រិតបាត និង តំបូល ( support and resistance)
បាត និង ដំបូល គឺជាគំនិតសំខាន់ៗនៅក្នុងការជួញដូរ Forex ដែលអ្នកជួញដូរត្រូវតែយល់ពីវា។
–“support” ជាកម្រិតតម្លៃនៅពេលដែលផ្សារកំពុងធ្លាក់ចុះហើយត្រូវបានផ្អាកព្រោះមានការទិញឡើងវិញ។
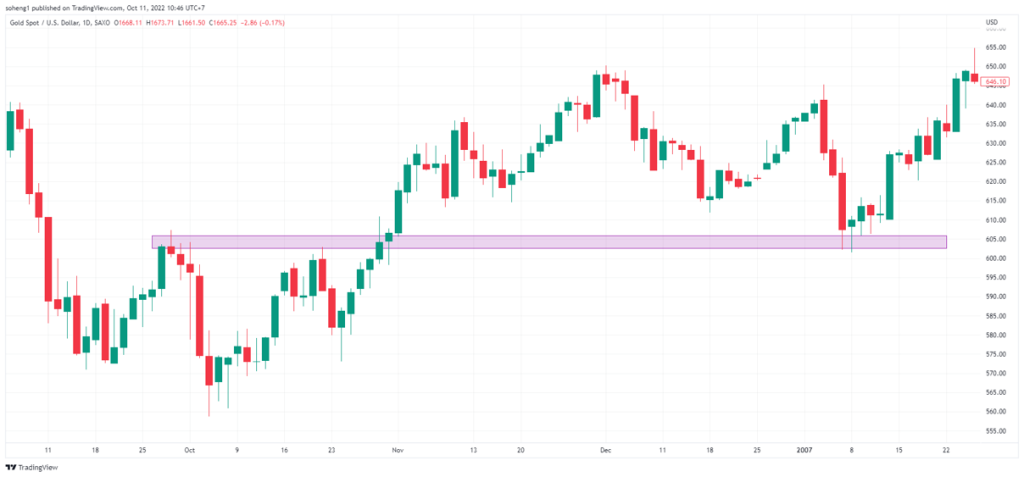
– “Resistance” ជាកម្រិតតម្លៃនៅពេលដែលផ្សារកំពុងឡើងហើយត្រូវផ្អាកព្រោះមានការលក់វិញ។
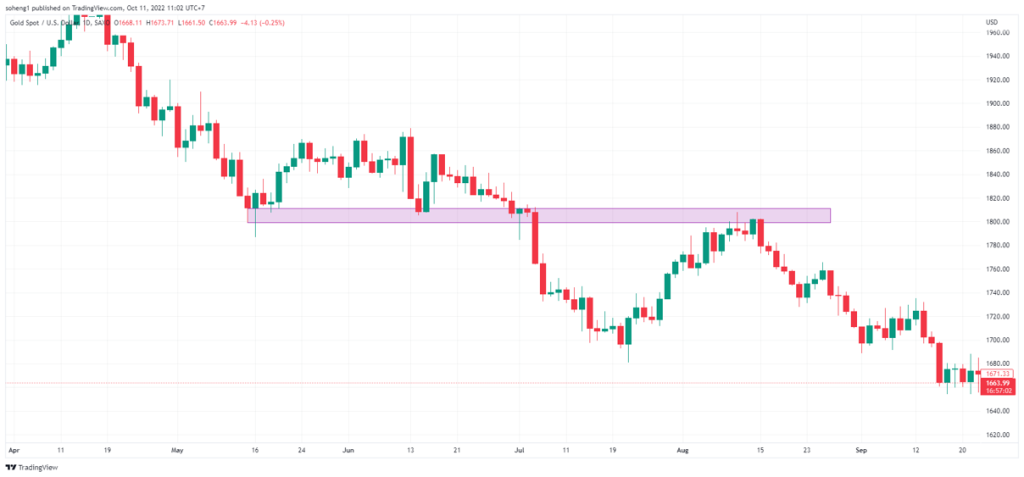
កម្រិតទាំងនេះមានសារៈសំខាន់ណាស់ ព្រោះវាបង្ហាញពីកន្លែងដែលតម្លៃអាចបញ្ច្រាស់ ឬជាប់គាំង ដោយផ្តល់ឱ្យឈ្មួញនូវឱកាសក្នុងការចូល ឬចាកចេញពីការជួញដូរ។
៥. “ប្រើសូចនាករបច្ចេកទេស”
សូចនាករបច្ចេកទេសគឺជាការគណនាគណិតវិទ្យាដោយផ្អែកលើតម្លៃ បរិមាណ ឬចំណាប់អារម្មណ៍បើកចំហ នៃគូរូបិយប័ណ្ណ។ សូចនាករពេញនិយមបំផុតមួយចំនួនរួមមាន:
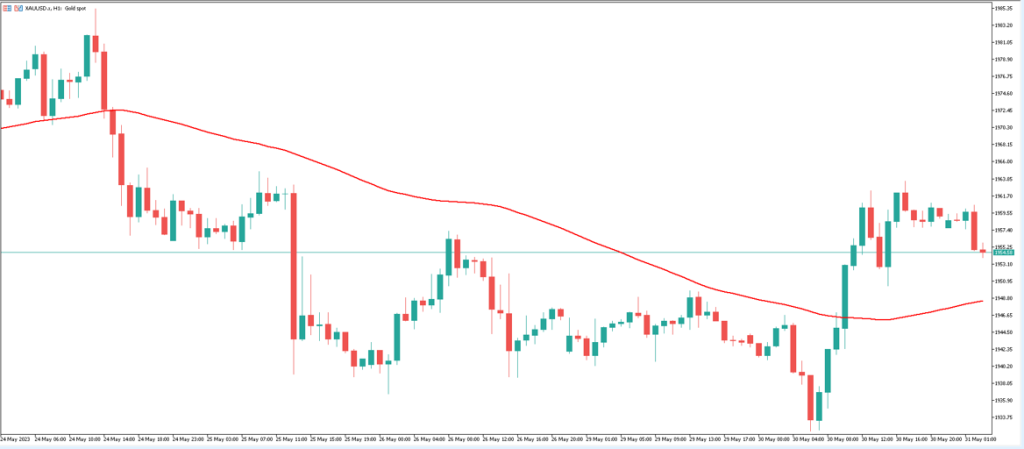
-“Moving Average “៖ ធ្វើឱ្យទិន្នន័យតម្លៃដំណើរការរលូនដើម្បីកំណត់និន្នាការក្នុងរយៈពេលជាក់លាក់ណាមួយ។
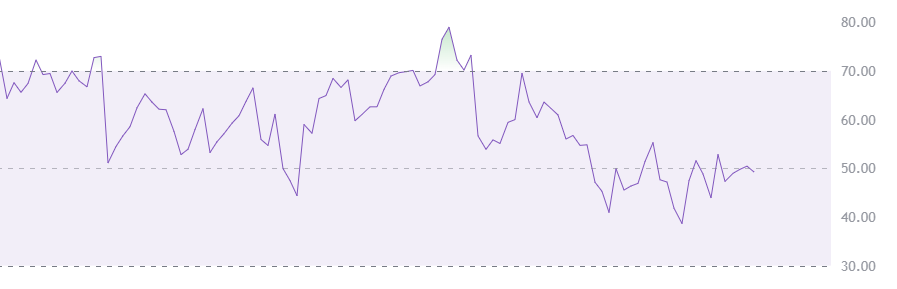
– “Relative Strength Index (RSI)” សូចនាករសន្ទុះដែលបង្ហាញថាតើរូបិយប័ណ្ណត្រូវបានទិញលើស ឬលក់លើស។
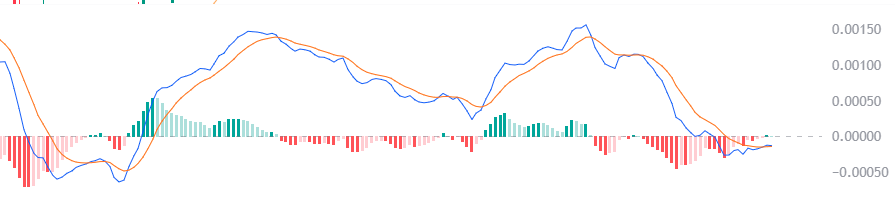
– “MACD (Moving Average Convergence Divergence)”៖ សូចនាករសន្ទុះតាមនិន្នាការដែលជួយកំណត់សញ្ញាទិញ និងលក់សក្តានុពលនៃផ្សារ។
៦. “ប្រើការវិភាគតម្លៃជាមួយនឹងសូចនាករបច្ចេកទេស(Technical Indicator)”
Trader ដែលទទួលបានជោគជ័យបំផុតតែងតែរួមបញ្ចូលគ្នានូវសកម្មភាពតម្លៃទីផ្សារជាមួយនឹងសូចនាករបច្ចេកទេសដើម្បីធ្វើឱ្យការព្យាករណ៍កាន់តែត្រឹមត្រូវ។ សកម្មភាពតម្លៃពាក់ព័ន្ធនឹងការសិក្សាអំពីចលនានៃតម្លៃរបស់ផ្សារ ខណៈពេលដែលសូចនាករផ្តល់ការបញ្ជាក់បន្ថែមចំពោះការវិភាគរបស់អ្នក។
៧. “ការអនុវត្ត និងបទពិសោធន៍”
មធ្យោបាយដ៏ល្អបំផុតដើម្បីកាន់តែប្រសើរឡើងក្នុងការអានទីផ្សារ Forex គឺតាមរយៈការអនុវត្ត។ ប្រើគណនីសាកល្បង(Demo Account) ដើម្បីសាកល្បងជាមួយប្រភេទតារាងផ្សារ ពេលវេលា និងសូចនាករ(Indicator) ផ្សេងៗ។ យូរៗទៅ អ្នកនឹងអភិវឌ្ឍការយល់ដឹងកាន់តែប្រសើរឡើងអំពីឥរិយាបថឬចលនាទីផ្សារ និងរបៀបធ្វើការសម្រេចចិត្តជួញដូរកាន់តែឆ្លាតវៃ។
សេចក្តីសន្និដ្ឋាន
ការអានតារាង Forex គឺជាជំនាញដ៏មានតម្លៃសម្រាប់ Trader។ តាមរយៈការយល់ដឹងអំពីមូលដ្ឋានគ្រឹះនៃប្រភេទតារាងផ្សារ ពេលវេលា លំនាំនៃCandlestick និងសូចនាករបច្ចេកទេស(Indicator) អ្នកអាចអភិវឌ្ឍន៍សមត្ថភាពរបស់អ្នកក្នុងការសម្រេចចិត្តជួញដូរ។ សូមចងចាំថាការអនុវត្តធ្វើឱ្យមានបទពិសោធន៍ល្អ—ដូច្នេះត្រូវចំណាយពេលដើម្បីស្គាល់ខ្លួនអ្នកជាមួយនឹងការអានតារាងផ្សារ និងកែលម្អយុទ្ធសាស្រ្តរបស់អ្នកតាមពេលវេលា។
|English Version|
Understanding Forex charts is crucial for any trader who wants to make informed decisions in the foreign exchange market. Whether you’re a beginner or looking to refine your skills, this step-by-step guide will walk you through the basics of reading Forex charts and interpreting price movements.
1.“Understand the Basics of Forex Charts”
Forex charts visually represent the price movements of currency pairs over a specific time period. These charts display historical data, allowing traders to analyze past performance and predict future price trends. The most common types of Forex charts are:
– “Line Chart”: This is the simplest form of chart, showing the closing prices over time. It’s ideal for getting an overview of price trends.
– “Bar Chart”: This chart shows the open, high, low, and close prices (OHLC) for a specific period. It provides more detailed information than the line chart.
– “Candlestick Chart”: The most popular chart type among traders, it also shows OHLC data but in a visually appealing format with “candlesticks” that represent each time period.
- “Recognize the Time Frames”
Forex charts come in various time frames, ranging from seconds to months. As a trader, you’ll need to decide which time frame is best for your trading style. Common time frames include:
– “1-minute chart (M1)”
– “5-minute chart (M5)”
– “15-minute chart (M15)”
– “1-hour chart (H1)”
– “4-hour chart (H4)”
– “Daily chart (D1)”
Shorter time frames are ideal for scalpers and day traders, while longer time frames are favored by swing traders and position traders.
- “Learn How to Interpret Candlestick Patterns”
Candlestick charts are favored by most traders because they provide clear insight into market sentiment. Each candlestick represents a certain time period and contains the following components:
– “Body”: The thick part of the candlestick, showing the open and close prices.
– “Wicks (or Shadows)”: The thin lines above and below the body, showing the highest and lowest prices during the period.
– “Bullish Candlestick”: When the close is higher than the open, typically shown in green or white.
– “Bearish Candlestick”: When the close is lower than the open, typically shown in red or black.
Learning to recognize common candlestick patterns such as Doji, Engulfing, and Hammer can help you predict price movements more accurately.
- “Identify Support and Resistance Levels”
Support and resistance are key concepts in Forex trading.
– “Support”: A price level where a downtrend can be expected to pause due to a concentration of buying interest.
– “Resistance”: A price level where a trend is expected to pause or reverse due to a concentration of selling interest.
These levels are crucial because they indicate where price may reverse or stall, giving traders opportunities to enter or exit trades.
- “Use Technical Indicators”
Technical indicators are mathematical calculations based on the price, volume, or open interest of a currency pair. Some of the most popular indicators include:
– “Moving Averages”: These smooth out price data to identify trends over a specific period.
– “Relative Strength Index (RSI)”: A momentum indicator that shows whether a currency is overbought or oversold.
– “MACD (Moving Average Convergence Divergence)”: A trend-following momentum indicator that helps identify potential buy and sell signals.
- “Combine Price Action with Indicators”
The most successful traders often combine price action with technical indicators to make more accurate predictions. Price action involves studying the movement of the price itself, while indicators provide additional confirmation to your analysis.
- 7. “Practice and Experiment”
The best way to get better at reading Forex charts is through practice. Use demo accounts to experiment with different chart types, time frames, and indicators. Over time, you’ll develop a better sense of market behavior and how to make smarter trading decisions.
Conclusion
Reading Forex charts is a valuable skill for any trader. By understanding the basics of chart types, time frames, candlestick patterns, and technical indicators, you can improve your ability to make informed trading decisions. Remember, practice makes perfect—so take the time to familiarize yourself with chart reading and refine your strategy over time. យល់ដឹងពីការអានទីផ្សារ Forex គឺមានសារៈសំខាន់សម្រាប់អ្នកជួញដូរ។ ម្យ៉ាងវិញទៀត ប្រសិនបើអ្នកជាអ្នកចាប់ផ្តើមដំបូង ឬក៏កំពុងស្វែងរកការកែលម្អជំនាញរបស់អ្នក ជំនួញនេះនឹងនាំអ្នកទៅកាន់ដំណាក់កាលនៃការអានទីផ្សារ Forex និងការបកស្រាយចលនាដឹកនាំតម្លៃនៃទីផ្សារ។
១.”យល់ដឹងពីមូលដ្ឋាននៃតារាង Forex”
តារាងទីផ្សារ Forex បង្ហាញពីចលនាតម្លៃរបស់គូរូបិយប័ណ្ណក្នុងរយៈពេលកំណត់។ តារាងទាំងនេះបង្ហាញទិន្នន័យប្រវតិ្តនៃទីផ្សារ ដែលអនុញ្ញាតឱ្យអ្នកជួញដូរវិភាគការសម្រេចចិត្តនៃការលក់និងការជួញដូរ។
ប្រភេទតារាងទីផ្សារ Forex ដែលពេញនិយមបំផុតមាន៖
– “តារាងជាបន្ទាត់(line chart)”: តារាងសាមញ្ញបំផុតដែលបង្ហាញតម្លៃបិទនៃការជួញដូរក្នុងរយៈពេលមួយ។
– “តារាងជារបារ(bar chart)”: បង្ហាញពីតម្លៃបើក, ខ្ពស់, ទាប និងបិទសម្រាប់រយៈពេលជាក់លាក់មួយ។វាផ្ដល់ព័ត៌មានលម្អិតជាងline chart
– “តារាងជា Candlestick”: ប្រភេទគំនូសតាងដ៏ពេញនិយមបំផុតក្នុងចំណោមពាណិជ្ជករ វាក៏បង្ហាញទិន្នន័យ OHLC ផងដែរ ប៉ុន្តែជាទម្រង់ទាក់ទាញដែលមើលឃើញជាមួយនឹង “ទាន” ដែលតំណាងឱ្យរយៈពេលនីមួយៗ។
២. “ស្គាល់ពីរយៈពេលនីមួយៗ”
តារាង Forex មានរយៈពេលផ្សេងៗគ្នា ដោយចាប់ពីនាទីទៅខែ។ ជាអ្នកជួញដូរ អ្នកត្រូវតែសម្រេចចិត្តថាតើរយៈពេលណាដែលសាកសមសម្រាប់ស្ទាយការជួញដូររបស់អ្នក។
- 1 នាទី (M1)
- 5នាទី (M5)
- 15 នាទី (M15)
- 30 នាទី (M30)
- 1 ម៉ោង (H1)
- 4 ម៉ោង (H4)
- 1 ថ្ងៃ (Daily)
- 1 សប្ដាហ៍ (W)
- 1 ខែ (Monthly)
៣. “សិក្សាអំពី candlestick pattern”
តារាងcandlestick ត្រូវបានគេចូលចិត្តយ៉ាងខ្លាំងដោយអ្នកជួញដូរពីព្រោះវាផ្តល់ការយល់ឃើញអំពីមូលដ្ឋាននៃអារម្មណ៍ទីផ្សារ។
-“តួនៃcandlestick(Body)” ជាផ្នែកដែលធំជាងគេនៃcandlestick ដែលអាចបង្ហាញឲ្យដឹងពីតម្លៃនៃការបិទនឹងបើកនៃការជួញដូរ។
- “ស្រមោលនៃទាន candlestick(shadows)” ជាខ្សែឬស្រមោលមានលក្ខណៈជាបន្ទាត់ដែលនៅពីលើនឹងពីក្រោមBody ដែលបង្ហាញពីតម្លៃដែលខ្ពស់បំផុតនឹងទាបបំផុតនៃការជួរដូរ។
-“បង្គោលឡើង (bullish candlestick)” ជាបង្គោលនៅពេលដែលបិទខ្ពស់ជាងពេលបើកដែលមានបង្គោលពណ៌សឬពណ៌បៃតង។
– “បង្គោលចុះ (bearish candlestick)” ជាបង្គោលនៅពេលដែលបិទទាបជាងពេលបើកដែលមានបង្គោលពណ៌ខ្មៅនឹងពណ៌ក្រហមជាសម្គាល់។ ការសិក្សាពី candlestickនៃទម្រង់រូបរាងវាដូចជា hammer Doji or Engulfing អាចជួយអ្នកក្នុងការមើលទីផ្សារទៅមុខទៀត។
៤. “សម្គាល់កម្រិតបាត និង តំបូល ( support and resistance)
បាត និង ដំបូល គឺជាគំនិតសំខាន់ៗនៅក្នុងការជួញដូរ Forex ដែលអ្នកជួញដូរត្រូវតែយល់ពីវា។
–“support” ជាកម្រិតតម្លៃនៅពេលដែលផ្សារកំពុងធ្លាក់ចុះហើយត្រូវបានផ្អាកព្រោះមានការទិញឡើងវិញ។
– “Resistance” ជាកម្រិតតម្លៃនៅពេលដែលផ្សារកំពុងឡើងហើយត្រូវផ្អាកព្រោះមានការលក់វិញ។
កម្រិតទាំងនេះមានសារៈសំខាន់ណាស់ ព្រោះវាបង្ហាញពីកន្លែងដែលតម្លៃអាចបញ្ច្រាស់ ឬជាប់គាំង ដោយផ្តល់ឱ្យឈ្មួញនូវឱកាសក្នុងការចូល ឬចាកចេញពីការជួញដូរ។
៥. “ប្រើសូចនាករបច្ចេកទេស”
សូចនាករបច្ចេកទេសគឺជាការគណនាគណិតវិទ្យាដោយផ្អែកលើតម្លៃ បរិមាណ ឬចំណាប់អារម្មណ៍បើកចំហ នៃគូរូបិយប័ណ្ណ។ សូចនាករពេញនិយមបំផុតមួយចំនួនរួមមាន:
-“Moving Average “៖ ធ្វើឱ្យទិន្នន័យតម្លៃដំណើរការរលូនដើម្បីកំណត់និន្នាការក្នុងរយៈពេលជាក់លាក់ណាមួយ។
– “Relative Strength Index (RSI)” សូចនាករសន្ទុះដែលបង្ហាញថាតើរូបិយប័ណ្ណត្រូវបានទិញលើស ឬលក់លើស។
– “MACD (Moving Average Convergence Divergence)”៖ សូចនាករសន្ទុះតាមនិន្នាការដែលជួយកំណត់សញ្ញាទិញ និងលក់សក្តានុពលនៃផ្សារ។
៦. “ប្រើការវិភាគតម្លៃជាមួយនឹងសូចនាករបច្ចេកទេស(Technical Indicator)”
Trader ដែលទទួលបានជោគជ័យបំផុតតែងតែរួមបញ្ចូលគ្នានូវសកម្មភាពតម្លៃទីផ្សារជាមួយនឹងសូចនាករបច្ចេកទេសដើម្បីធ្វើឱ្យការព្យាករណ៍កាន់តែត្រឹមត្រូវ។ សកម្មភាពតម្លៃពាក់ព័ន្ធនឹងការសិក្សាអំពីចលនានៃតម្លៃរបស់ផ្សារ ខណៈពេលដែលសូចនាករផ្តល់ការបញ្ជាក់បន្ថែមចំពោះការវិភាគរបស់អ្នក។
៧. “ការអនុវត្ត និងបទពិសោធន៍”
មធ្យោបាយដ៏ល្អបំផុតដើម្បីកាន់តែប្រសើរឡើងក្នុងការអានទីផ្សារ Forex គឺតាមរយៈការអនុវត្ត។ ប្រើគណនីសាកល្បង(Demo Account) ដើម្បីសាកល្បងជាមួយប្រភេទតារាងផ្សារ ពេលវេលា និងសូចនាករ(Indicator) ផ្សេងៗ។ យូរៗទៅ អ្នកនឹងអភិវឌ្ឍការយល់ដឹងកាន់តែប្រសើរឡើងអំពីឥរិយាបថឬចលនាទីផ្សារ និងរបៀបធ្វើការសម្រេចចិត្តជួញដូរកាន់តែឆ្លាតវៃ។
សេចក្តីសន្និដ្ឋាន
ការអានតារាង Forex គឺជាជំនាញដ៏មានតម្លៃសម្រាប់ Trader។ តាមរយៈការយល់ដឹងអំពីមូលដ្ឋានគ្រឹះនៃប្រភេទតារាងផ្សារ ពេលវេលា លំនាំនៃCandlestick និងសូចនាករបច្ចេកទេស(Indicator) អ្នកអាចអភិវឌ្ឍន៍សមត្ថភាពរបស់អ្នកក្នុងការសម្រេចចិត្តជួញដូរ។ សូមចងចាំថាការអនុវត្តធ្វើឱ្យមានបទពិសោធន៍ល្អ—ដូច្នេះត្រូវចំណាយពេលដើម្បីស្គាល់ខ្លួនអ្នកជាមួយនឹងការអានតារាងផ្សារ និងកែលម្អយុទ្ធសាស្រ្តរបស់អ្នកតាមពេលវេលា។
|English Version|
Understanding Forex charts is crucial for any trader who wants to make informed decisions in the foreign exchange market. Whether you’re a beginner or looking to refine your skills, this step-by-step guide will walk you through the basics of reading Forex charts and interpreting price movements.
1.“Understand the Basics of Forex Charts”
Forex charts visually represent the price movements of currency pairs over a specific time period. These charts display historical data, allowing traders to analyze past performance and predict future price trends. The most common types of Forex charts are:
– “Line Chart”: This is the simplest form of chart, showing the closing prices over time. It’s ideal for getting an overview of price trends.
– “Bar Chart”: This chart shows the open, high, low, and close prices (OHLC) for a specific period. It provides more detailed information than the line chart.
– “Candlestick Chart”: The most popular chart type among traders, it also shows OHLC data but in a visually appealing format with “candlesticks” that represent each time period.
- “Recognize the Time Frames”
Forex charts come in various time frames, ranging from seconds to months. As a trader, you’ll need to decide which time frame is best for your trading style. Common time frames include:
– “1-minute chart (M1)”
– “5-minute chart (M5)”
– “15-minute chart (M15)”
– “1-hour chart (H1)”
– “4-hour chart (H4)”
– “Daily chart (D1)”
Shorter time frames are ideal for scalpers and day traders, while longer time frames are favored by swing traders and position traders.
- “Learn How to Interpret Candlestick Patterns”
Candlestick charts are favored by most traders because they provide clear insight into market sentiment. Each candlestick represents a certain time period and contains the following components:
– “Body”: The thick part of the candlestick, showing the open and close prices.
– “Wicks (or Shadows)”: The thin lines above and below the body, showing the highest and lowest prices during the period.
– “Bullish Candlestick”: When the close is higher than the open, typically shown in green or white.
– “Bearish Candlestick”: When the close is lower than the open, typically shown in red or black.
Learning to recognize common candlestick patterns such as Doji, Engulfing, and Hammer can help you predict price movements more accurately.
- “Identify Support and Resistance Levels”
Support and resistance are key concepts in Forex trading.
– “Support”: A price level where a downtrend can be expected to pause due to a concentration of buying interest.
– “Resistance”: A price level where a trend is expected to pause or reverse due to a concentration of selling interest.
These levels are crucial because they indicate where price may reverse or stall, giving traders opportunities to enter or exit trades.
- “Use Technical Indicators”
Technical indicators are mathematical calculations based on the price, volume, or open interest of a currency pair. Some of the most popular indicators include:
– “Moving Averages”: These smooth out price data to identify trends over a specific period.
– “Relative Strength Index (RSI)”: A momentum indicator that shows whether a currency is overbought or oversold.
– “MACD (Moving Average Convergence Divergence)”: A trend-following momentum indicator that helps identify potential buy and sell signals.
- “Combine Price Action with Indicators”
The most successful traders often combine price action with technical indicators to make more accurate predictions. Price action involves studying the movement of the price itself, while indicators provide additional confirmation to your analysis.
- 7. “Practice and Experiment”
The best way to get better at reading Forex charts is through practice. Use demo accounts to experiment with different chart types, time frames, and indicators. Over time, you’ll develop a better sense of market behavior and how to make smarter trading decisions.
Conclusion
Reading Forex charts is a valuable skill for any trader. By understanding the basics of chart types, time frames, candlestick patterns, and technical indicators, you can improve your ability to make informed trading decisions. Remember, practice makes perfect—so take the time to familiarize yourself with chart reading and refine your strategy over time.