Understand Tweezer Top and Tweezer Bottom
អ្វីទៅជា Tweezer Top?
និយមន័យ
Tweezer Top គឺជាសញ្ញាវិលត្រឡប់នៃលំហូរចុះ វាបង្ហាញភាគច្រើននៅចុងនៃលំហូរឡើង។
រូបរាង
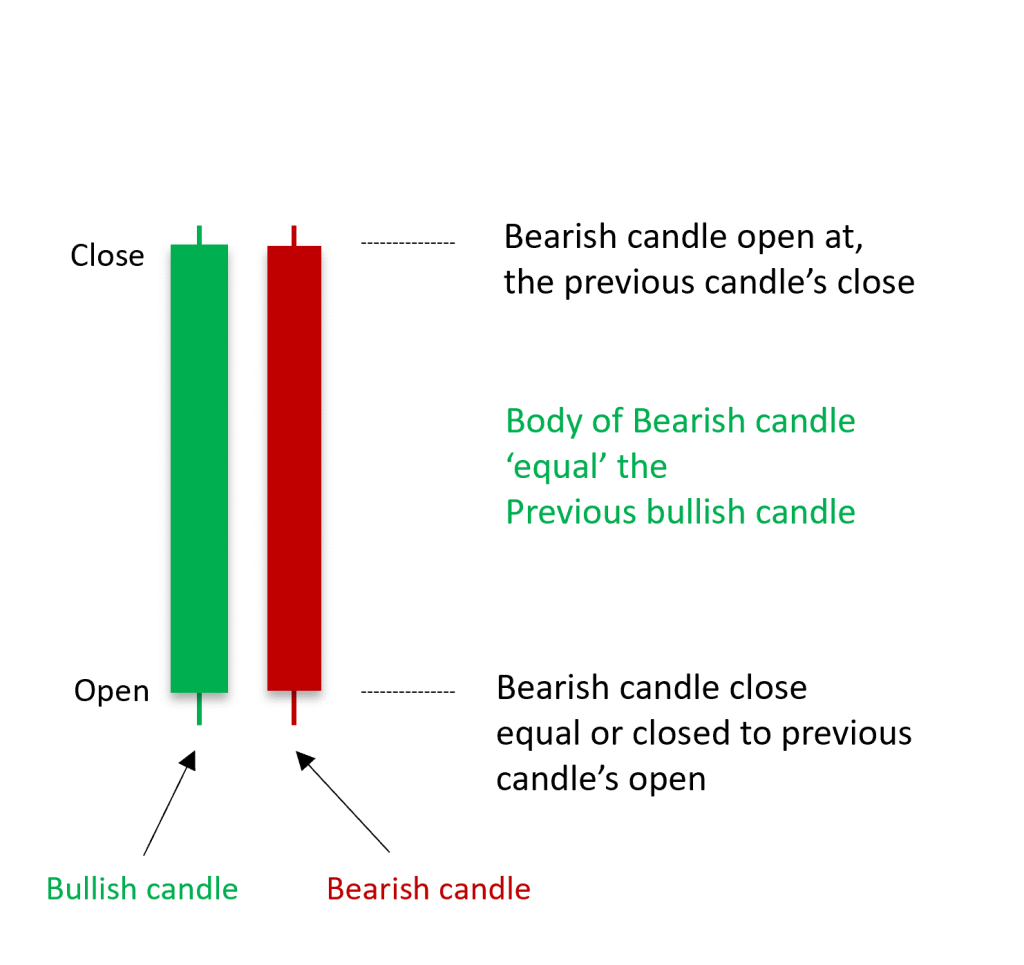
លក្ខណៈសម្គាល់
ទម្រង់ Tweezer Top តម្លៃព្យាយាមបុកបំបែកទៅតំបន់ដែលខ្ពស់ជាងមុន ប៉ុន្តែវាបង្កើតបានជាទម្រង់ Tweezer Top ដែលនេះជាសញ្ញានៃកាវិលត្រឡប់នៃលំហូរ។
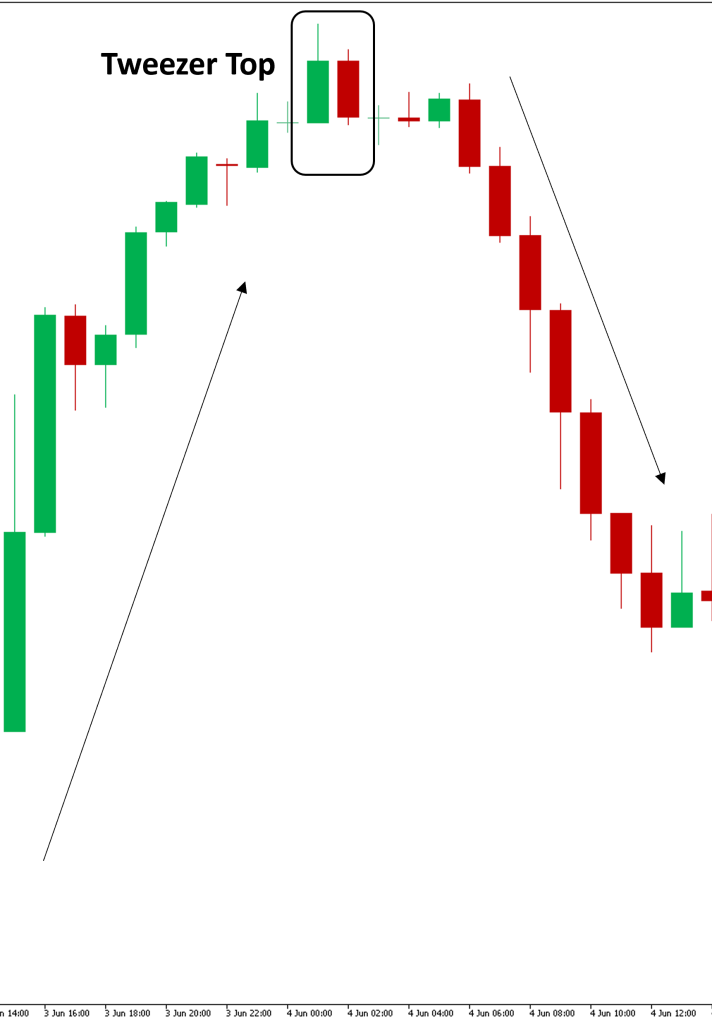
ការកំណត់ Tweezer Top នៅលើតារាង
នៅខាងចុងនៃលំហូរឡើង វាបង្កើតបានជាទម្រង់ Tweezer Top

អ្វីទៅជា Tweezer Bottom?
និយមន័យ
ទម្រង់Tweezer Bottom គឺជាសញ្ញានៃកាវិលត្រឡប់នៃលំហូរឡើង វាបង្ហាញភាគច្រើននៅចុងនៃលំហូរចុះ។
រូបរាង

លក្ខណៈសម្គាល់
គំរូ Tweezer Bottom នៅក្នុងលំហូរចុះ តម្លៃព្យាយាមបុកបំបែកទៅតំបន់ដែលទាបជាងមុន ប៉ុន្តែវាបង្កើតបានជា ទម្រង់ Tweezer Bottom នេះជាសញ្ញាបង្ហាញថា កាវិលត្រឡប់នៃលំហូរចុះអាចកើតមាន ។
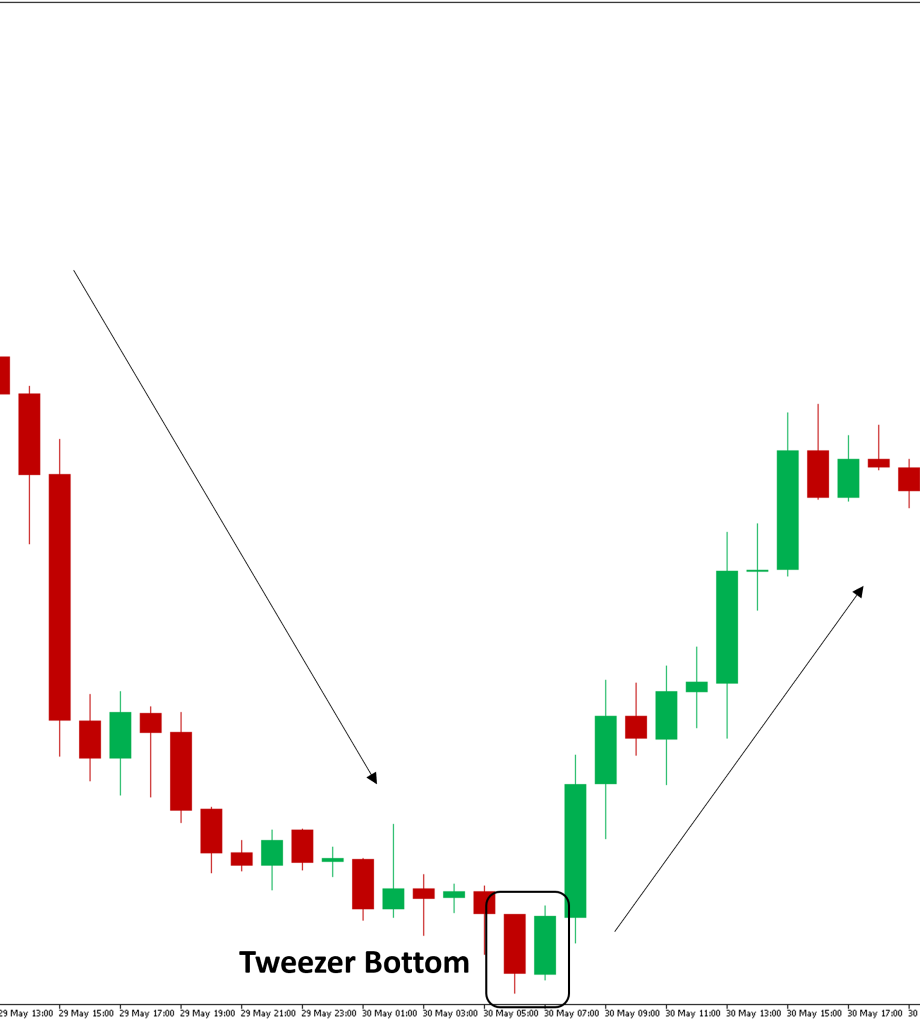
ការកំណត់ Tweezer Bottom នៅលើផ្ទាំងតម្លៃ
នៅខាងចុងនៃលំហូរចុះ វាងបង្កើតបានជា ទម្រង់ Tweezer Bottom
ការគ្រប់គ្រងហានិភ័យ
ពិនិត្យមើលការសម្រេចចិត្តទិញលក់របស់អ្នកអោយបានច្បាស់លាស់។ ប្រើទំហំសមស្របនិងគ្រប់គ្រងការទិញលក់ដោយប្រើ stop-loss ដើម្បីការពារទ្រព្យសម្បត្តិរបស់អ្នក។
សេចក្តីសន្និដ្ឋាន
ការយល់ដឹងនិងកំណត់អត្តសញ្ញាណ Tweezer Top, និង Tweezer Bottom អាចធ្វើឱ្យយុទ្ធសាស្រ្តទិញលក់របស់អ្នកប្រសើរឡើង។ គំរូទាំងនេះផ្តល់នូវការយល់ដឹងអំពីការបញ្ច្រាសទីផ្សារសក្តានុពល ប៉ុន្តែត្រូវបានប្រើប្រាស់ជាមួយឧបករណ៍វិភាគបច្ចេកទេសផ្សេងទៀតនិងការគ្រប់គ្រងហានិភ័យ។
What is the Tweezer Top Pattern?
Definition
A Tweezer Top pattern is a bearish reversal pattern that typically appears at the end of an uptrend.
Appearance
Characteristics
The Tweezer Top pattern indicates that prices attempted to break into higher regions but formed a Tweezer Top, signaling a potential reversal.
Identifying a Tweezer Top on a Chart
Look for the pattern at the end of an uptrend, where two or more candles have matching highs.
What is the Tweezer Bottom Pattern?
Definition
A Tweezer Bottom pattern is a bullish reversal pattern that typically appears at the end of a downtrend.
Appearance
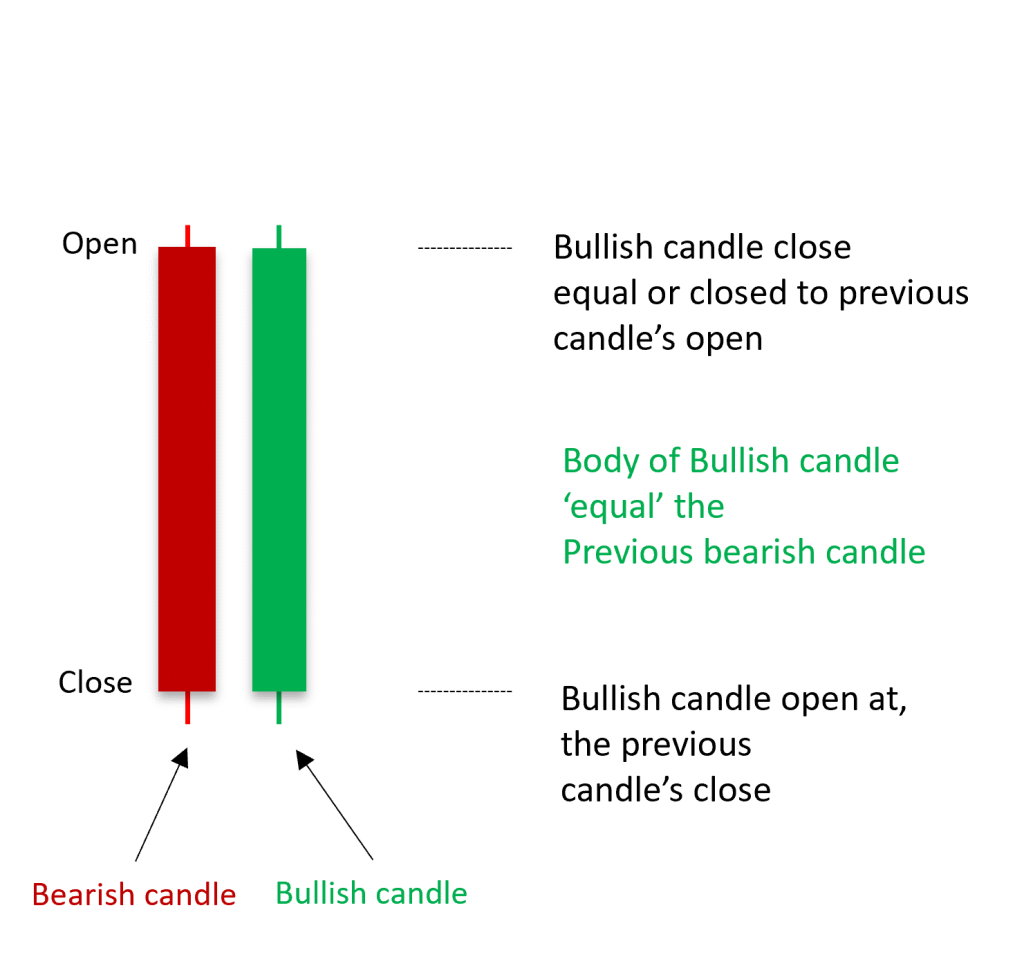
Characteristics
The Tweezer Bottom pattern indicates that prices attempted to break into lower regions but formed a Tweezer Bottom, signaling a potential reversal.
Identifying a Tweezer Bottom on a Chart
Look for the pattern at the end of a downtrend, where two or more candles have matching lows.

Risk Management
Assess your trading decisions carefully. Use appropriate position sizing and manage trades using stop-loss orders to protect your capital.
Conclusion
Understanding and correctly identifying Tweezer Top, and Tweezer Bottom patterns can greatly enhance your trading strategy. These patterns provide valuable insights into potential market reversals, but they should be used in conjunction with other technical analysis tools and risk management practices.