មាតិកា/ Content:
ជ្រើសរើសមាតិកាខាងក្រោម ដើម្បីយកមកសិក្សាឈ្វេងយល់
ទស្សនវិស័យទីផ្សារប្រចាំសប្តាហ៍គិតត្រឹមថ្ងៃទី 19 ខែឧសភា ឆ្នាំ 2026
កត្តាសំខាន់ៗដែលត្រូវតាមដានបំផុតសម្រាប់សប្តាហ៍នេះគឺនឹងដាក់បញ្ចូលនៅក្នុងរបាយការណ៍ខាងក្រោមនេះដោយវិនិយោគិនអាចប្រើប្រាស់ព័ត៌មានខាងក្រោមជាមូលដ្ឋានគ្រឹះមុនពេលធ្វើការសម្រេចចិត្តលើការជួញដូរលើទ្រព្យណាមួយ។ របាយការណ៍នេះរួមបញ្ចូលទាំងការវិភាគបែបសេដ្ឋកិច្ច (Fundamental Analysis) ដែលជាកត្តាសំខាន់ៗជំរុញចលនាទីផ្សារ និងការវិភាគបែបបច្ចេកទេស (Technical Analysis) រួមទាំងចលនាតម្លៃ និងតំបន់សាច់ប្រាក់ (Liquidity Zones) សំខាន់ៗ ដែលវិនិយោគិនគួរតែតាមដាន។
ការបដិសេធ (Disclaimer): របាយការណ៍នេះធ្វើឡើងក្នុងគោលបំណងផ្សព្វផ្សាយការអប់រំ និងព័ត៌មានដែលគួរដឹងតែប៉ុណ្ណោះ។ សូមមេត្តាកំុប្រើប្រាស់របាយការណ៍នេះជាដំបូន្មានវិនិយោគ ឬជាសញ្ញាសម្រាប់ការជួញដូររបស់អ្នក។
ការវិភាគបែបសេដ្ឋកិច្ច (Fundamental Analysis)
កត្តាបីយ៉ាងដែលត្រូវផ្តោតលើសប្តាហ៍នេះ៖
ព្រឹត្តិការណ៍ប្រតិទិនសេដ្ឋកិច្ច
ប្រតិទិនសេដ្ឋកិច្ចសប្ដាហ៍នេះមានព្រឹត្តិការណ៍សំខាន់ៗជាច្រើន ដែលអាចបង្កឱ្យមានភាពប្រែប្រួល នៅលើគូរូបិយប័ណ្ណសំខាន់ៗ។

ការចេញផ្សាយទិន្នន័យសន្ទស្សន៍តម្លៃទំនិញប្រើប្រាស់ (CPI) របស់ចក្រភពអង់គ្លេស និងសហភាពអឺរ៉ុប នឹងត្រូវបានតាមដានយ៉ាងជិតស្និទ្ធ ដោយសារតែទិន្នន័យនេះជាសូចនាករសំខាន់នៃអតិផរណា។ ប្រសិនបើទិន្នន័យខ្ពស់ជាងការរំពឹងទុក វាអាចគាំទ្រប្រាក់ផោនអង់គ្លេស (GBP) និង និងប្រាក់អឺរ៉ូ (EUR) ដោយពង្រឹងការរំពឹងអំពីគោលនយោបាយរូបិយវត្ថុតឹងរ៉ឹង ខណៈទិន្នន័យទាបអាចដាក់សម្ពាធលើរូបិយប័ណ្ណទាំងពីរ។

នៅសហរដ្ឋអាមេរិក កំណត់ហេតុកិច្ចប្រជុំ FOMC (FOMC Meeting Minutes) នឹងផ្តល់ការយល់ដឹងបន្ថែមអំពីទិសដៅគោលនយោបាយរបស់ធនាគារកណ្តាលអាមេរិក (Federal Reserve)។
- បើកំណត់ហេតុកិច្ចប្រជុំបង្ហាញនូវគោលជំហរបែប hawkish ដែលបង្ហាញពីការព្រួយបារម្ភអតិផរណាបន្ត នោះព័ត៌មាននេះអាចគាំទ្រប្រាក់ដុល្លារអាមេរិក ហើយដាក់សម្ពាធលើតម្លៃមាស។
- ផ្ទុយទៅវិញ បើកំណត់ហេតុកិច្ចប្រជុំនេះបង្ហាញនូវគោលជំហរបែប dovish នោះព័ត៌មាននេះអាចបន្ថយតម្លៃប្រាក់ដុល្លារអាមេរិក ហើយគាំទ្រតម្លៃមាសវិញដោយសារការរំពឹងអំពីការកាត់បន្ថយអត្រាការប្រាក់នៅពេលអនាគតកើនឡើង។
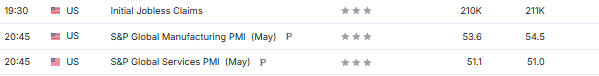
ក្នុងពេលដូចគ្នា ទិន្នន័យ Initial Jobless Claims នឹងផ្តល់រូបភាពទាន់ពេលអំពីស្ថានភាពទីផ្សារការងារ។ ចំនួនទាបជាងការរំពឹងទុកជាទូទៅបង្ហាញពីភាពរឹងមាំនៃទីផ្សារការងារ និងអាចគាំទ្រប្រាក់ដុល្លារអាមេរិក ខណៈចំនួនខ្ពស់អាចបង្ហាញពីភាពទន់ខ្សោយ។
ចុងក្រោយ សន្ទស្សន៍អ្នកគ្រប់គ្រងផលិតកម្មសកលរបស់ S&P (S&P Global Manufacturing PMI) និងសន្ទស្សន៍អ្នកគ្រប់គ្រងសេវាកម្មសកល S&P (S&P Global Services PMI) នឹងផ្តល់សញ្ញាមុនអំពីសកម្មភាពសេដ្ឋកិច្ច។ លទ្ធផលខ្ពស់អាចជំរុញទំនុកចិត្តទីផ្សារ និងគាំទ្រប្រាក់ដុល្លារអាមេរិក ខណៈទិន្នន័យទាបអាចបង្កការព្រួយបារម្ភអំពីការថយចុះនៃកំណើនសេដ្ឋកិច្ច។
ការអភិវឌ្ឍសង្គ្រាមរវាងសហរដ្ឋអាមេរិក និងអ៊ីរ៉ង់
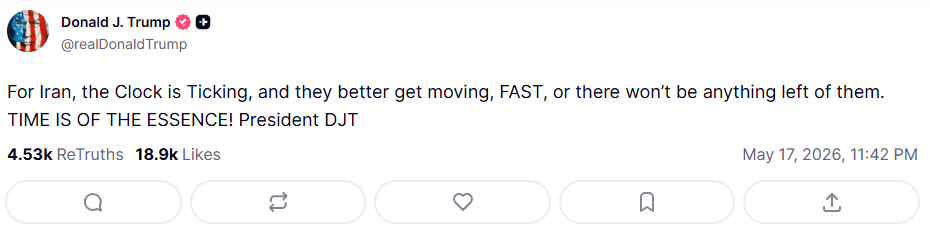
ភាពតានតឹងភូមិសាស្ត្រនយោបាយរវាងសហរដ្ឋអាមេរិក និងអ៊ីរ៉ង់នៅតែស្ថិតក្នុងកម្រិតខ្ពស់ ខណៈការរីកចម្រើនក្នុងការរកដំណោះស្រាយនៅតែមានកំណត់។ លោក Donald Trump បានបង្ហោះសារនៅលើ Truth Social កាលពីថ្ងៃទី 18 ខែឧសភា ឆ្នាំ 2026 ថា៖ “ពេលវេលាជិតអស់ហើយសម្រាប់អ៊ីរ៉ង់។ ពួកគេត្រូវតែចាត់វិធានការឱ្យបានលឿន។”
បន្ថែមពីនេះ មានរបាយការណ៍អំពីការវាយប្រហារដោយដ្រូនដែលប៉ះពាល់ដល់តំបន់ UAE និងអារ៉ាប៊ីសាអូឌីត ដែលបង្ហាញពីហានិភ័យនៃការកើនឡើងបន្ថែមនៃជម្លោះនៅមជ្ឈិមបូព៌ា។

ប្រសិនបើជម្លោះកាន់តែធ្ងន់ធ្ងរ តម្លៃប្រេងអាចកើនឡើង ដោយសារការព្រួយបារម្ភអំពីការរំខានផ្គត់ផ្គង់ ជាពិសេសតាមផ្លូវដឹកជញ្ជូនសំខាន់ៗ។ តម្លៃមាសក៏អាចកើនឡើងដែរពីតម្រូវការទ្រព្យសកម្មសុវត្ថិភាព (Safe-Haven Assets) ក្នុងអំឡុងពេលមានភាពតានតឹងភូមិសាស្ត្រនយោបាយ។
ប៉ុន្តែ ការកើនឡើងបន្តរបស់តម្លៃប្រេងអាចជំរុញការរំពឹងអតិផរណាខ្ពស់ ដែលអាចនាំឱ្យទីផ្សាររំពឹងថានឹងមានគោលនយោបាយរូបិយវត្ថុតឹងរ៉ឹង។ ក្នុងស្ថានភាពនេះ កំណើនតម្លៃមាសអាចត្រូវបានកំណត់ ឬមានភាបបម្រែបម្រួលខ្ពស់ ជាពិសេសបើប្រាក់ដុល្លារអាមេរិកមានភាពរឹងមាំ។
ធនាគារកណ្តាលអាមេរិកក្រោមការដឹកនាំថ្មី
ការយកចិត្តទុកដាក់របស់ទីផ្សារកំពុងផ្ដោតលើធនាគារកណ្តាលអាមេរិក បន្ទាប់ពីការតែងតាំងលោក Kevin Warsh ជាប្រធានថ្មី។
ការរំពឹងរបស់ទីផ្សារបង្ហាញពីគោលនយោបាយចម្រុះ ដោយលោក Kevin Warsh អាចមានគោលជំហរបែប dovish ចំពោះអត្រាការប្រាក់ (គាំទ្រការកាត់បន្ថយនៅពេលអនាគត) ខណៈរក្សាទិសដៅ hawkish ចំពោះតារាងសមតុល្យ (balance sheet) ដោយគាំទ្រការកាត់បន្ថយទ្រព្យសកម្ម (quantitative tightening) បន្ត។
ក្នុងរយៈពេលខ្លី គេនៅតែរំពឹងយ៉ាងទូលំទូលាយថាធនាគារកណ្តាលអាមេរិកនឹងរក្សាអត្រាការប្រាក់ឱ្យនៅដដែល ខណៈវាយតម្លៃនិន្នាការអតិផរណា និងស្ថានភាពសេដ្ឋកិច្ចទូទៅ។ បរិយាកាសគោលនយោបាយតឹងរ៉ឹងនេះ អាចបន្តគាំទ្រប្រាក់ដុល្លាអាមេរិក និងកំណត់កំណើនតម្លៃមាស។
មើលទៅមុខ ប្រសិនបើការរំពឹងអំពីការកាត់អត្រាការប្រាក់កើនឡើង ជាពិសេសបើអតិផរណាបន្ថយ ឬភាពតានតឹងភូមិសាស្ត្រនយោបាយធូរស្រាល កត្តាទាំងអស់នេះអាចដាក់សម្ពាធលើប្រាក់ដុល្លាអាមេរិក ហើយគាំទ្រតម្លៃមាស។ ផ្ទុយទៅវិញ អតិផរណាខ្ពស់បន្ត ឬភាពតានតឹងកាន់តែខ្លាំង អាចពន្យារពេលការកាត់អត្រាការប្រាក់ បង្កើនភាពរឹងមាំរបស់ប្រាក់ដុល្លាអាមេរិក និងកំណត់កំណើនមាស។
វិនិយោគិនគួរតែតាមដានយ៉ាងជិតស្និទ្ធនូវការប្រាស្រ័យទាក់ទងពីធនាគារកណ្តាលអាមេរិក និងកំណត់ហេតុកិច្ចប្រជុំ FOMC នៅក្នុងសប្តាហ៍នេះ ដើម្បីទទួលបានទិសដៅច្បាស់លាស់នៃគោលនយោបាយរូបិយវត្ថុរបស់សហរដ្ឋអាមេរិក។
ការវិភាគបច្ចេកទេស (Technical Analysis)
គូរមាសធៀបដូល្លាអាមេរិក

ការបន្តលំហូរចុះ
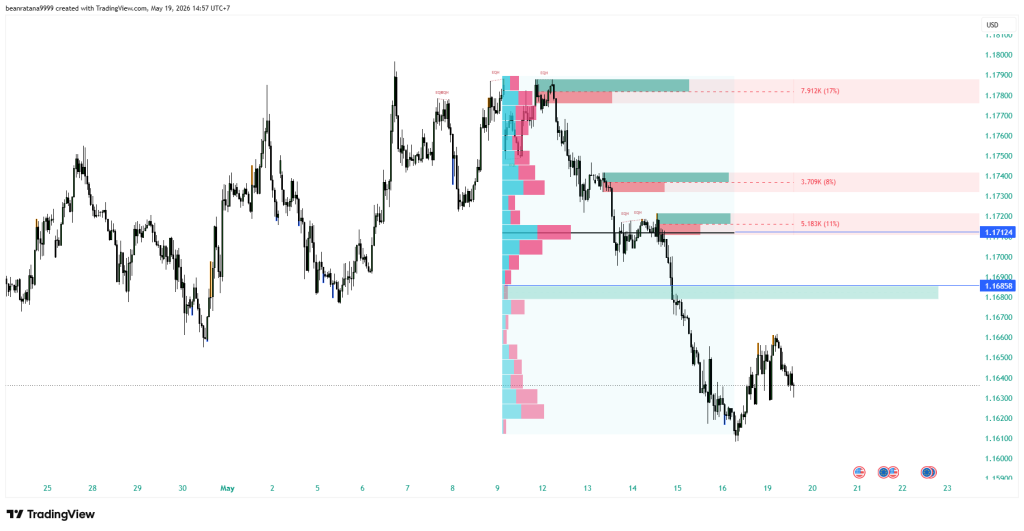
ទីផ្សារបានបង្ហាញទម្រង់ Volume Profile រាងជាអក្សរ P កាលពីសប្តាហ៍មុន ដែលបញ្ជាក់ពីដំណាក់កាល distribution យ៉ាងខ្លាំង តាមពីក្រោយដោយការធ្លាក់ចុះ (markdown) យ៉ាងខ្លាំង។ ទោះបីជាទំនោរទូទៅសម្រាប់សប្តាហ៍នេះនៅតែបន្តស្ថិតក្នុងទិសដៅធ្លាក់ចុះ (bearish) ក៏ដោយ ក៏ price action ទំនងជានឹងមានការកែតម្រូវតម្លៃ (retrace) មុននឹងបន្តធ្លាក់ចុះថែមទៀត។ តំបន់សំខាន់ដែលត្រូវយកចិត្តទុកដាក់គឺកម្រិត Low Volume Node (LVN) នៅតម្លៃ 4632។ តំបន់នេះនឹងដើរតួជា resistance យ៉ាងសំខាន់ ហើយគួរតែជាចំណុចគោលសម្រាប់តាមដានរកឱកាសចូលលក់ (short entries) ដ៏ល្អបំផុត។
សេណារីយ៉ូនៃការប្តូរនិន្នាការ (Trend Reversal Scenario):
ផ្អែកលើ Volume Profile ចំណុច Point of Control (POC) របស់សប្តាហ៍មុនគឺស្ថិតនៅកម្រិតតម្លៃ 4691។ កម្រិតនេះតំណាងឱ្យការប្រមូលផ្តុំ volume ជួញដូរច្រើនជាងគេបំផុត និងដើរតួជាចំណុច pivot យ៉ាងសំខាន់។ ប្រសិនបើ price action ហក់ឡើង និងបំបែក (breakout) ហើយឈរជើងបានលើសពី 4691 វានឹងធ្វើឱ្យទំនោរធ្លាក់ចុះ (bearish) បច្ចុប្បន្នអស់សុពលភាព និងផ្តល់សញ្ញាពីការផ្លាស់ប្តូរទម្រង់និន្នាការទៅជាការកើនឡើងវិញ។
គូរ អុឺរ៉ូធៀបដូល្លាអាមេរិក
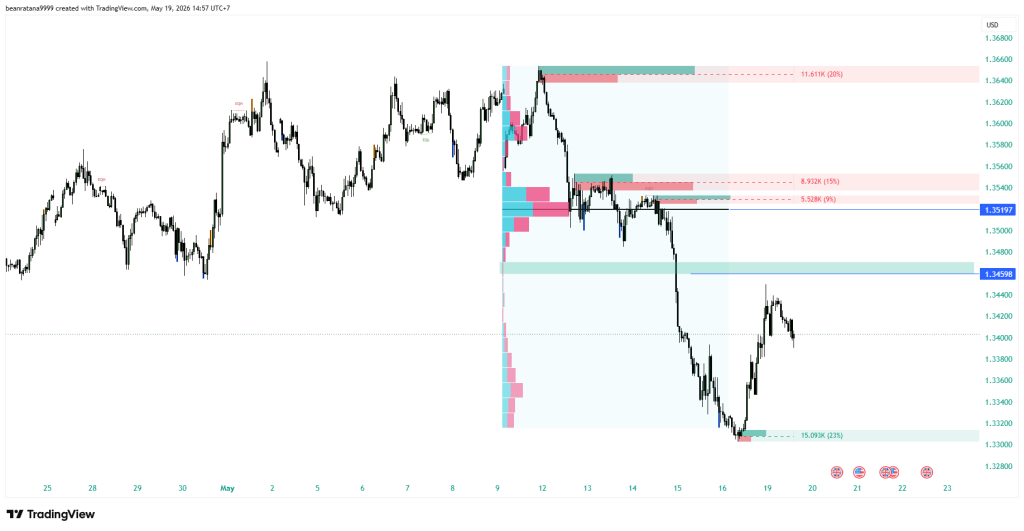
សេណារីយ៉ូនៃការបន្តនិន្នាការធ្លាក់ចុះ (Downtrend Continuation Scenario): Volume profile បង្ហាញថាថ្មីៗនេះទីផ្សារបានឆ្លងកាត់ដំណាក់កាលធ្លាក់ចុះ (markdown) យ៉ាងសំខាន់ពី upper distribution blocks។ ទៅមុខទៀត ទំនោរទូទៅនៅតែបន្តស្ថិតក្នុងទិសដៅធ្លាក់ចុះ (bearish) ហើយយើងរំពឹងថានឹងមានការបន្តធ្លាក់ចុះថែមទៀត។ ទោះជាយ៉ាងណាក៏ដោយ មុននឹងបន្តធ្លាក់ចុះទៅក្រោមទៀត ត្រេឌ័រគួរតែរំពឹងថានឹងមានការកែតម្រូវតម្លៃ (pullback) ត្រលប់ទៅរកកម្រិត Low Volume Node (LVN) នៅក្បែរតម្លៃ 1.16858។ តំបន់នេះដើរតួជា resistance យ៉ាងសំខាន់ពីខាងលើ ហើយគឺជាតំបន់ចម្បងដែលត្រូវតាមដានរកឱកាសចូលលក់ (short setups) ដែលមានប្រូបាប៊ីលីតេខ្ពស់ មុនពេលនិន្នាការធ្លាក់ចុះចាប់ផ្តើមបន្តទៀត។
ករណីអស់សុពលភាពនៃការធ្លាក់ចុះ (Bullish Invalidation Case / Trend Reversal): Volume profile បានបង្ហាញយ៉ាងច្បាស់នូវកម្រិត Point of Control (POC) ចម្បងនៅតម្លៃ 1.17124 ដែលតំណាងឱ្យការប្រមូលផ្តុំ liquidity យ៉ាងច្រើន និងជាខ្សែបន្ទាត់ការពារចុងក្រោយសម្រាប់អ្នកលក់ (sellers)។ ប្រសិនបើទីផ្សាររុញច្រានឡើងលើ និងអាចទម្លុះតំបន់នេះបានដោយជោគជ័យ វានឹងបញ្ជាក់ពីការបរាជ័យនៃនិន្នាការធ្លាក់ចុះ (downtrend) បច្ចុប្បន្ន។ ការទម្លុះតម្លៃ (breakout) និងការឈរជើងបានយ៉ាងរឹងមាំនៅលើកម្រិត 1.17124 គួរតែត្រូវបានចាត់ទុកថាជាសញ្ញាដ៏ច្បាស់លាស់មួយនៃការផ្លាស់ប្តូរទម្រង់និន្នាការ (structural trend reversal) ដែលទាមទារឱ្យមានការផ្លាស់ប្តូរភ្លាមៗទៅកាន់ទំនោរកើនឡើង (bullish directional bias)វិញ។
គូរផោនធៀបដូល្លាអាមេរិក
សេណារីយ៉ូនៃការបន្តនិន្នាការធ្លាក់ចុះ (Downtrend Continuation Scenario): Volume profile បង្ហាញថាថ្មីៗនេះទីផ្សារបានឆ្លងកាត់ដំណាក់កាលធ្លាក់ចុះ (markdown) យ៉ាងសំខាន់ពី upper distribution block។ ទៅមុខទៀត ទំនោរទូទៅនៅតែបន្តស្ថិតក្នុងទិសដៅធ្លាក់ចុះ (bearish) ហើយយើងរំពឹងថានឹងមានការបន្តធ្លាក់ចុះថែមទៀត។ ទោះជាយ៉ាងណាក៏ដោយ មុននឹងបន្តធ្លាក់ចុះទៅក្រោមទៀត ត្រេឌ័រគួរតែរំពឹងថានឹងមានការកែតម្រូវតម្លៃ (pullback) ត្រលប់ទៅរកកម្រិត Low Volume Node (LVN) នៅក្បែរតម្លៃ 1.34598។ តំបន់នេះដើរតួជា resistance យ៉ាងសំខាន់ពីខាងលើ ហើយគឺជាតំបន់ចម្បងដែលត្រូវតាមដានរកឱកាសចូលលក់ (short setups) ដែលមានប្រូបាប៊ីលីតេខ្ពស់ មុនពេលនិន្នាការធ្លាក់ចុះចាប់ផ្តើមបន្តទៀត។
ករណីអស់សុពលភាពនៃការធ្លាក់ចុះ (Bullish Invalidation Case / Trend Reversal): Volume profile បានបង្ហាញយ៉ាងច្បាស់នូវកម្រិត Point of Control (POC) ចម្បងនៅតម្លៃ 1.35197 ដែលតំណាងឱ្យការប្រមូលផ្តុំ liquidity ក្នុងប្រវត្តិសាស្រ្តយ៉ាងច្រើនបំផុត និងជាខ្សែបន្ទាត់ការពារចុងក្រោយសម្រាប់អ្នកលក់ (sellers)។ ប្រសិនបើទីផ្សាររុញច្រានឡើងលើ និងអាចទម្លុះតំបន់នេះបានដោយជោគជ័យ វានឹងបញ្ជាក់ពីការបរាជ័យនៃនិន្នាការធ្លាក់ចុះ (downtrend) បច្ចុប្បន្ន។ ការទម្លុះតម្លៃ (breakout) និងការឈរជើងបានយ៉ាងរឹងមាំនៅលើកម្រិត 1.35197 គួរតែត្រូវបានចាត់ទុកថាជាសញ្ញាដ៏ច្បាស់លាស់មួយនៃការផ្លាស់ប្តូរទម្រង់និន្នាការ (structural trend reversal) ដែលទាមទារឱ្យមានការផ្លាស់ប្តូរភ្លាមៗទៅកាន់ទំនោរកើនឡើង (bullish directional bias)វិញ។
| English Version |
This report highlights key developments for the week ahead, providing investors with relevant context to support informed trading decisions. It covers both fundamental analysis—the primary drivers behind market movements—and technical analysis, including price action and key liquidity zones that traders should monitor.
Disclaimer: This material is provided for educational and informational purposes only and should not be considered as investment advice or a trading signal.
Fundamental Analysis
Three factors to focus on this week from the fundamental side:
Economic Calendar Events
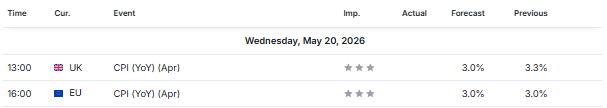
This week’s economic calendar features several high-impact events that may drive volatility across major currency pairs. The UK and EU CPI (YoY) releases will be closely monitored as key indicators of inflation. Stronger-than-expected readings could support GBP and EUR, as they may reinforce expectations of tighter monetary policy, while softer data may weigh on both currencies.

In the United States, the FOMC Meeting Minutes will provide deeper insight into the Federal Reserve’s policy outlook.
- A hawkish tone—highlighting persistent inflation concerns—may support the USD and pressure gold prices.
- Conversely, a dovish tone could weaken the USD and support gold, as expectations for future rate cuts increase.

Meanwhile, Initial Jobless Claims will offer a timely snapshot of labor market conditions. Lower-than-expected claims typically signal resilience in the labor market and may support the USD, while higher claims could indicate softening conditions.
Finally, the preliminary S&P Global Manufacturing and Services PMI data will provide early signals on economic activity. Strong readings may boost market sentiment and support the USD, while weaker data could raise concerns over slowing growth.
U.S.-Iran War Developments
Geopolitical tensions between the United States and Iran remain elevated, with limited progress toward a resolution. President Donald Trump posted on Truth Social on May 18th, 2026, saying, “For Iran, the Clock is Ticking, and they better get moving, FAST, or there won’t be anything left of them. TIME IS OF THE ESSENCE! President DJT.”

Additionally, there have also been reports of drone attacks affecting regional players such as the UAE and Saudi Arabia, highlighting the risk of broader escalation in the Middle East.
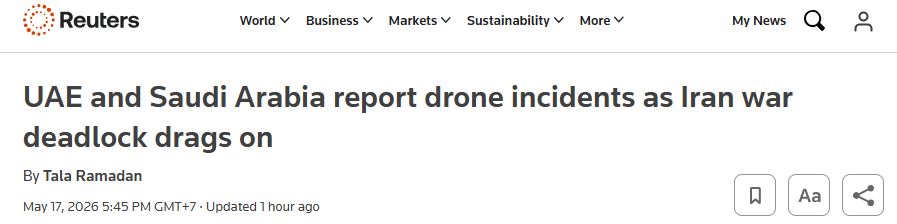
If the conflict intensifies, oil prices are likely to move higher, driven by concerns over potential supply disruptions, particularly in key transit routes. Gold may also benefit from increased safe-haven demand during periods of heightened uncertainty.
However, sustained increases in oil prices could contribute to higher inflation expectations, which may lead markets to anticipate a more cautious or restrictive monetary policy stance. In such a scenario, gold’s upside may be limited or become more volatile, especially if the USD strengthens.
Federal Reserve Under New Leadership
Market attention is also focused on the Federal Reserve following the appointment of Kevin Warsh as the new Fed Chair.
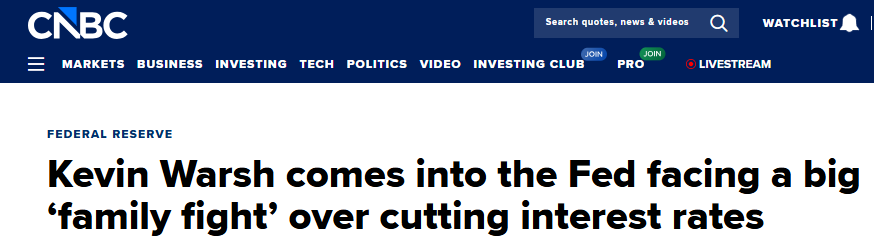
Market expectations suggest a mixed policy stance, with Warsh potentially leaning dovish on interest rates—supporting the possibility of future rate cuts—while maintaining a hawkish approach to the balance sheet, favoring quantitative tightening.
In the near term, the Federal Reserve is still widely expected to hold interest rates steady, as policymakers assess inflation trends and broader economic conditions. This relatively tight policy environment may continue to provide underlying support for the USD and limit upside in gold.
Looking ahead, if expectations for rate cuts strengthen—particularly if inflation moderates or geopolitical risks ease—this could weigh on the USD and support gold prices. Conversely, persistent inflation or escalating geopolitical tensions may delay rate cuts, reinforcing USD strength and keeping gold price gains in check.
Traders should closely monitor communication from the Federal Reserve, as well as the upcoming FOMC Meeting Minutes, for clearer direction on policy.
Technical Analysis
Gold Technical Analysis
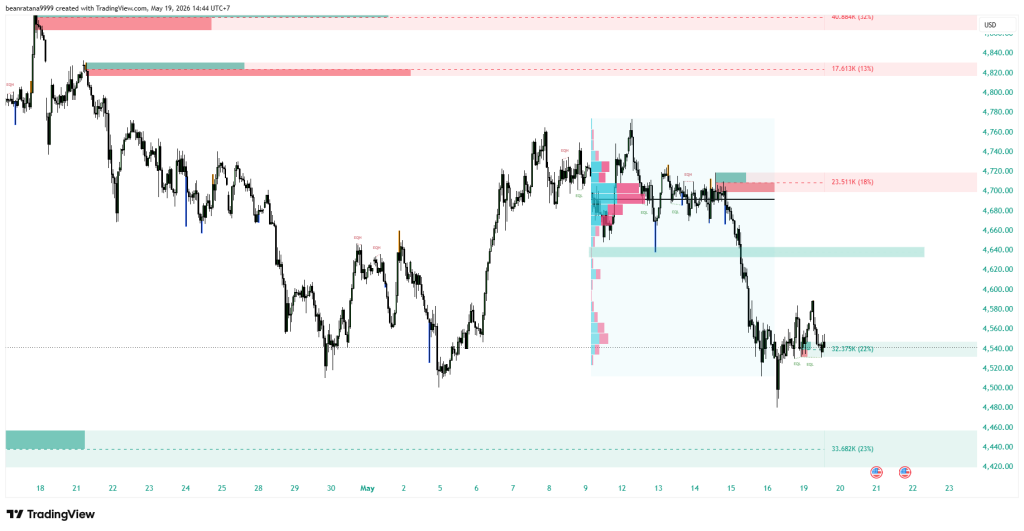
The market exhibited a P-shaped volume profile last week, confirming a heavy distribution phase followed by a strong markdown. While the broader directional bias remains bearish for this week, price action is likely to retrace before continuing lower. The primary area of interest is the Low Volume Node (LVN) at the 4632 level. This zone will act as crucial structural resistance and should be the focal point for monitoring optimal short entries.
Trend Reversal Scenario: Looking at the volume distribution, last week’s Point of Control (POC) is established at 4691. This level represents the heaviest concentration of trading volume and acts as a critical pivot. If price action rallies and sustains a breakout above 4691, it will invalidate the current bearish bias and signal a structural trend shift to the upside.
EUR/USD Technical Analysis

Downtrend Continuation Scenario: The volume profile indicates the market recently underwent a significant markdown phase from the upper distribution blocks. Moving forward, the broader directional bias remains bearish, and we anticipate further downside continuation. However, prior to the next leg down, traders should expect a corrective pullback to the Low Volume Node (LVN) near the 1.16858 level. This zone serves as immediate structural overhead resistance and is the primary area to monitor for high-probability short setups before the downtrend resumes.
Bullish Invalidation Case (Trend Reversal): The volume profile highlights the primary Point of Control (POC) at the 1.17124 level, representing a heavy concentration of historical liquidity and the ultimate line in the sand for sellers. Should the market push higher and successfully breach this zone, it would indicate a failure of the current downtrend. A sustained breakout and market acceptance above 1.17124 should be interpreted as a clear signal of a structural trend reversal, requiring an immediate shift to a bullish directional bias.
GBP/USD Technical Analysis

Downtrend Continuation Scenario: The volume profile indicates the market recently underwent a significant markdown phase from the upper distribution block. Moving forward, the broader directional bias remains bearish, and we anticipate further downside continuation. However, prior to the next leg down, traders should expect a corrective pullback to the Low Volume Node (LVN) near the 1.34598 level. This zone serves as immediate structural overhead resistance and is the primary area to monitor for high-probability short setups before the downtrend resumes.Bullish Invalidation Case (Trend Reversal): The volume profile highlights the primary Point of Control (POC) at the 1.35197 level, representing the heaviest concentration of historical liquidity and the ultimate line in the sand for sellers. Should the market push higher and successfully breach this zone, it would indicate a failure of the current downtrend. A sustained breakout and market acceptance above 1.35197 should be interpreted as a clear signal of a structural trend reversal, requiring an immediate shift to a bullish directional bias.