
កត្តាសំខាន់ៗដែលត្រូវតាមដានបំផុតសម្រាប់សប្តាហ៍នេះគឺនឹងដាក់បញ្ចូលនៅក្នុងរបាយការណ៍ខាងក្រោមនេះដោយវិនិយោគិនអាចប្រើប្រាស់ព័ត៌មានខាងក្រោមជាមូលដ្ឋានគ្រឹះមុនពេលធ្វើការសម្រេចចិត្តលើការជួញដូរលើទ្រព្យណាមួយ។ របាយការណ៍នេះរួមបញ្ចូលទាំងការវិភាគបែបសេដ្ឋកិច្ច (Fundamental Analysis) ដែលជាកត្តាសំខាន់ៗជំរុញចលនាទីផ្សារ និងការវិភាគបែបបច្ចេកទេស (Technical Analysis) រួមទាំងចលនាតម្លៃ និងតំបន់សាច់ប្រាក់ (Liquidity Zones) សំខាន់ៗ ដែលវិនិយោគិនគួរតែតាមដាន។
ការបដិសេធ (Disclaimer): របាយការណ៍នេះធ្វើឡើងក្នុងគោលបំណងផ្សព្វផ្សាយការអប់រំ និងព័ត៌មានដែលគួរដឹងតែប៉ុណ្ណោះ។ សូមមេត្តាកំុប្រើប្រាស់របាយការណ៍នេះជាដំបូន្មានវិនិយោគ ឬជាសញ្ញាសម្រាប់ការជួញដូររបស់អ្នក។
ការវិភាគបែបសេដ្ឋកិច្ច (Fundamental Analysis)
កត្តាបួនយ៉ាងដែលត្រូវផ្តោតលើសប្តាហ៍នេះ៖
សង្ខេបសប្តាហ៍មុន – ទិន្នន័យសេដ្ឋកិច្ច
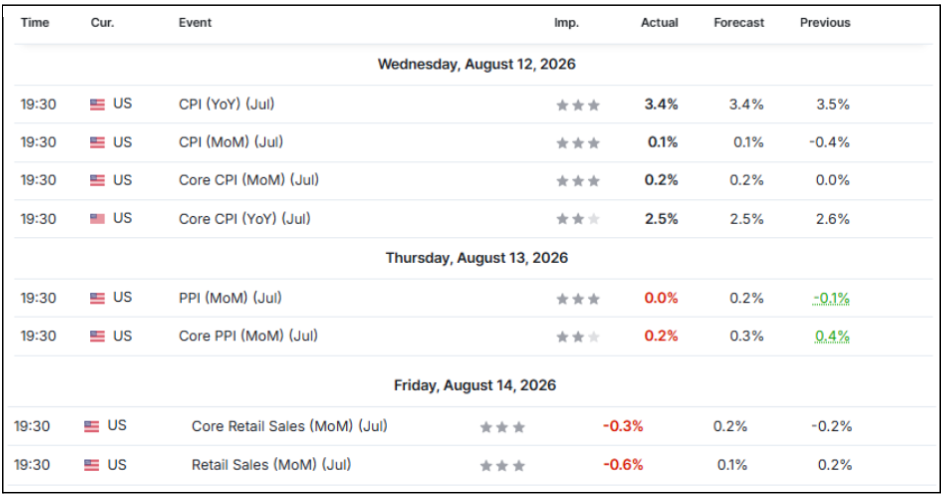
កាលពីសប្តាហ៍មុន ទិន្នន័យសេដ្ឋកិច្ចសំខាន់ៗរបស់សហរដ្ឋអាមេរិកបានបង្ហាញពីសម្ពាធអតិផរណាដែលនៅតែមាន ប៉ុន្តែមិនបានកើនឡើងលើសការរំពឹងទុក។ សន្ទស្សន៍ថ្លៃទំនិញប្រើប្រាស់ (CPI) ប្រចាំឆ្នាំក្នុងខែកក្កដា ស្ថិតនៅ 3.4% ខណៈ CPI ប្រចាំខែ និង Core CPI ប្រចាំខែដែលមិនរាប់ចូលតម្លៃអាហារនិងថាមពល ស្ថិតនៅ 0.1% និង 0.2% រៀងគ្នា ដែលសុទ្ធតែស្របតាមការព្យាករណ៍ ខណៈ Core CPI ប្រចាំឆ្នាំធ្លាក់ចុះមក 2.5% ពី 2.6% ក្នុងខែមុន។ ទន្ទឹមនឹងនេះសន្ទស្សន៍ថ្លៃផលិតកម្ម (PPI) ប្រចាំខែមិនមានការកើនឡើងនៅ 0.0% ខណៈ Core PPI ប្រចាំខែកើន 0.2% ប៉ុន្តែទាំងពីរទាបជាងការព្យាករណ៍។ នៅចុងសប្តាហ៍ Retail Sales ក៏ធ្លាក់ចុះ 0.6% និង Core Retail Sales ធ្លាក់ចុះ 0.3% ដែលទាបជាងការរំពឹងទុកយ៉ាងខ្លាំង បង្ហាញពីភាពទន់ខ្សោយនៃការចំណាយរបស់អ្នកប្រើប្រាស់។ សរុបមក ទិន្នន័យសប្តាហ៍មុនបានផ្តល់សញ្ញាចម្រុះ ដោយអតិផរណាមិនបានកើនលើសការរំពឹងទុក ខណៈទិន្នន័យការលក់រាយបង្ហាញពីសកម្មភាពសេដ្ឋកិច្ចដែលអាចកំពុងចុះខ្សោយ។
ការរំពឹងទុកអំពីការដំឡើងអត្រាការប្រាក់របស់ធនាគារកណ្តាលអាមេរិក (Fed) កំពុងថយចុះ
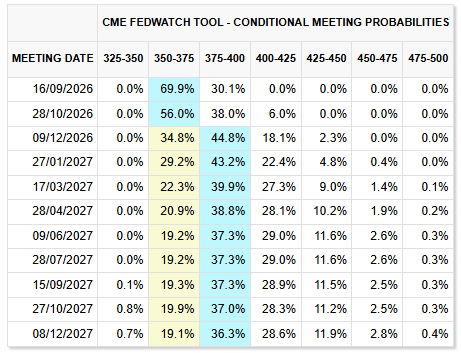
ជាមួយនឹងកិច្ចប្រជុំ FOMC លើកក្រោយដែលនឹងប្រព្រឹត្តទៅប្រមាណមួយខែទៀត ការរំពឹងទុករបស់ទីផ្សារចំពោះជំហានបន្ទាប់របស់ Fed បានចាប់ផ្តើមផ្លាស់ប្តូរ។ ក្នុងកិច្ចប្រជុំ FOMC ពីរលើកចុងក្រោយ Fed បានរក្សាជំហរប្រុងប្រយ័ត្ន និងមានភាព Hawkish ក្នុងកម្រិតមួយ ដោយរក្សាអត្រាការប្រាក់នៅដដែល ខណៈនៅតែបើកលទ្ធភាពសម្រាប់ការរឹតបន្តឹងគោលនយោបាយបន្ថែម។ ទោះជាយ៉ាងណា ការរំពឹងទុករបស់ទីផ្សារបានផ្លាស់ប្តូរយ៉ាងខ្លាំង។ កាលពីប៉ុន្មានសប្តាហ៍មុន CME FedWatch Tool បានបង្ហាញថា ការដំឡើងអត្រាការប្រាក់ 0.25% គឺជាលទ្ធផលដែលមានប្រូបាប៊ីលីតេខ្ពស់បំផុតសម្រាប់កិច្ចប្រជុំ FOMC ខែកញ្ញា។ ប៉ុន្តែបច្ចុប្បន្ន ការរំពឹងទុកបានផ្លាស់ប្តូរយ៉ាងខ្លាំង ដោយ CME FedWatch Tool កំពុងកំណត់ប្រូបាប៊ីលីតេ 69.9% សម្រាប់ការរក្សាអត្រាការប្រាក់នៅដដែល និងត្រឹមតែ 30.1% សម្រាប់ការដំឡើងអត្រាការប្រាក់នៅខែកញ្ញា។
ដូច្នេះ តើកត្តាអ្វីខ្លះដែលបណ្តាលឱ្យការរំពឹងទុកនេះផ្លាស់ប្តូរ?
កត្តាសំខាន់ពីរគឺ ទិន្នន័យទីផ្សារការងារដែលចុះខ្សោយ និងអតិផរណាដែលនៅតែខ្ពស់ ប៉ុន្តែមិនសូវមានសញ្ញាកើនឡើងបន្ថែម។ ចាប់ផ្តើមពីទីផ្សារការងារ ទិន្នន័យ Nonfarm Payrolls (NFP) របស់សហរដ្ឋអាមេរិកបានទាបជាងការរំពឹងទុករយៈពេលពីរខែជាប់គ្នា ដោយទិន្នន័យខែកក្កដាមានភាពខ្សោយជាពិសេស។ NFP ខែកក្កដាបានចេញមកនៅ -23K បើធៀបនឹងការរំពឹងទុក +85K ដែលមានន័យថា ចំនួនការងារសរុបបានថយចុះក្នុងអំឡុងខែនោះ។ ស្ថានភាពនេះផ្តល់ហេតុផលឱ្យ Fed មានការប្រុងប្រយ័ត្នជាងមុនចំពោះការរឹតបន្តឹងគោលនយោបាយបន្ថែម ព្រោះអត្រាការប្រាក់ខ្ពស់អាចដាក់សម្ពាធបន្ថែមលើទីផ្សារការងារដែលកំពុងចុះខ្សោយរួចទៅហើយ។
ទន្ទឹមនឹងនេះ អតិផរណានៅតែស្ថិតក្នុងកម្រិតខ្ពស់ ប៉ុន្តែមិនបានបង្ហាញពីការកើនឡើងដែលអាចពង្រឹងហេតុផលសម្រាប់ការដំឡើងអត្រាការប្រាក់បន្ថែមនោះទេ។ CPI ប្រចាំឆ្នាំ ក្នុងខែកក្កដាបានចេញមកនៅ 3.4% ស្របតាមការរំពឹងទុក និងទាបជាងបន្តិចពី 3.5% ក្នុងខែមិថុនា។ សំខាន់ជាងនេះទៅទៀត CPI ប្រចាំឆ្នាំក្នុងខែមិថុនាបានចេញមកទាបជាងការរំពឹងទុករួចទៅហើយ ដោយស្ថិតនៅ 3.5% បើធៀបនឹងការព្យាករណ៍ 3.8%។ ចំណែកឯ Core CPI ប្រចាំឆ្នាំ ក្នុងខែកក្កដាក៏នៅតែស្ថិតក្នុងកម្រិតស្របតាមការព្យាករណ៍ ដោយស្ថិតនៅ 2.5%។ ទិន្នន័យ PPI ក៏បានផ្តល់សញ្ញាស្រដៀងគ្នា ដោយទិន្នន័យតម្លៃពីផ្នែកផលិតកម្មមិនបានបង្ហាញសញ្ញាច្បាស់លាស់នៃការកើនឡើងអតិផរណាឡើងវិញនោះទេ។
នៅពេលពិចារណាលើទិន្នន័យទាំងនេះ វាមិនមានន័យថាអតិផរណាត្រូវបានគ្រប់គ្រងបានទាំងស្រុងនោះទេ ដោយសារគោលដៅអតិផរណា 2% របស់ Fed នៅតែស្ថិតនៅឆ្ងាយ។ ទោះជាយ៉ាងណា អតិផរណាមិនកំពុងកើនឡើង ខណៈទីផ្សារការងារកំពុងបង្ហាញសញ្ញាចុះខ្សោយ។ កត្តាទាំងពីរនេះកាត់បន្ថយភាពចាំបាច់ដែល Fed ត្រូវរក្សាជំហរ Hawkish ខ្លាំង ជាពិសេសដោយសារការដំឡើងអត្រាការប្រាក់បន្ថែមអាចដាក់សម្ពាធកាន់តែខ្លាំងលើសកម្មភាពសេដ្ឋកិច្ច និងការងារ។ ដូច្នេះ វានៅតែឆាប់ពេកក្នុងការនិយាយថា Fed បានផ្លាស់ប្តូរយ៉ាងច្បាស់ពីជំហរ Hawkish ទៅ Dovish ប៉ុន្តែមានសញ្ញាកាន់តែច្បាស់ថា តុល្យភាពនៃហានិភ័យកំពុងផ្លាស់ទីទៅរកជំហរដែលមានភាព Hawkish តិចជាងមុន។ សម្រាប់មាស ការធ្លាក់ចុះបន្ថែមនៃការរំពឹងទុកអំពីការដំឡើងអត្រាការប្រាក់ អាចបង្កើតបរិយាកាសវិជ្ជមានសម្រាប់មាសតាមទស្សនៈ Fundamental Analysis ជាពិសេសប្រសិនបើទិន្នន័យទីផ្សារការងារ និងអតិផរណានាពេលខាងមុខបន្តគាំទ្រនិន្នាការនេះ។
ព្រឹត្តិការណ៍ប្រតិទិនសេដ្ឋកិច្ចសប្តាហ៍នេះ
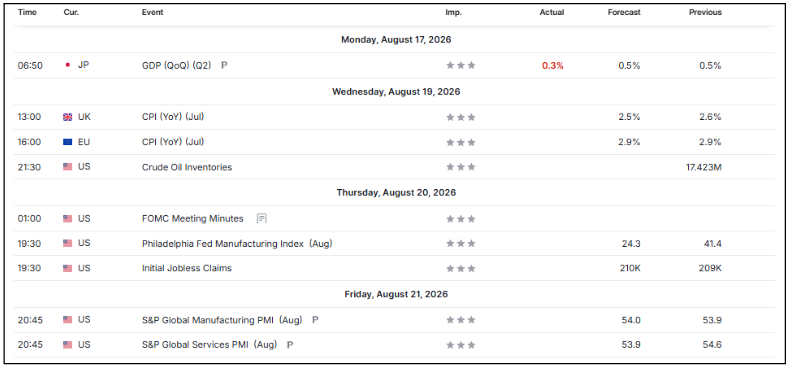
ប្រតិទិនទិន្នន័យសេដ្ឋកិច្ចក្នុងសប្តាហ៍នេះមិនសូវមានទិន្នន៍យសំខាន់ច្រើនទេ ប៉ុន្តែទិន្នន័យសំខាន់ៗមួយចំនួននៅតែអាចមានឥទ្ធិពលលើទីផ្សាររូបិយប័ណ្ណ និងមាស។ សប្តាហ៍នេះនឹងចាប់ផ្តើមជាមួយ CPI របស់ចក្រភពអង់គ្លេស និង CPI របស់សហភាពអឺរ៉ុបដែលនឹងផ្តល់ព័ត៌មានថ្មីអំពីនិន្នាការអតិផរណា និងអាចប៉ះពាល់ដល់ការរំពឹងទុកអំពីគោលនយោបាយរូបិយវត្ថុរបស់ ធនាគារកណ្តាលអង់គ្លេស (BoE) និង ធនាគារកណ្តាលអឺរ៉ុប (ECB)។ បន្ទាប់មក ទីផ្សារនឹងផ្តោតលើ កំណត់ហេតុកិច្ចប្រជុំ FOMC (FOMC Meeting Minutes) ដែលអាចផ្តល់សញ្ញាបន្ថែមអំពីទិសដៅគោលនយោបាយរបស់ Fed និងទិសដៅអត្រាការប្រាក់របស់សហរដ្ឋអាមេរិក។ នៅចុងសប្តាហ៍ US Initial Jobless Claims នឹងផ្តល់ព័ត៌មានថ្មីអំពីស្ថានភាពទីផ្សារការងារ ខណៈ ទិនិ្នន៍យ PMI បថមរបស់ S&P Global (Preliminary US S&P Global Manufacturing & Services PMI) នឹងផ្តល់សញ្ញាដំបូងអំពីស្ថានភាពសកម្មភាពសេដ្ឋកិច្ចរបស់សហរដ្ឋអាមេរិក។ ជារួម ទិន្នន័យទាំងនេះអាចមានឥទ្ធិពលលើការរំពឹងទុកអំពីគោលនយោបាយរបស់ធនាគារកណ្តាល និងបង្កើនភាពប្រែប្រួលនៅក្នុងទីផ្សារ GBP, EUR, USD និងមាស។
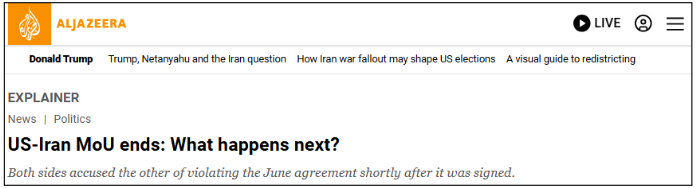
អនុស្សរណៈយោគយល់រវាងសហរដ្ឋអាមេរិក និងអ៊ីរ៉ង់ផុតកំណត់ជាផ្លូវការ៖ តើមានអ្វីកើតឡើងបន្ទាប់?
ដោយសារការរំពឹងទុកអំពីអត្រាការប្រាក់នៅតែជាកត្តាសំខាន់បំផុតដែលជំរុញតម្លៃមាសនៅពេលនេះ ទិសដៅបន្ទាប់នៃជម្លោះនេះមានសារៈសំខាន់ជាចម្បងតាមរយៈផលប៉ះពាល់របស់វាទៅលើ អតិផរណា និងគោលនយោបាយរបស់ Fed ជាជាងតម្រូវការមាសជាទ្រព្យសុវត្ថិភាពតែមួយមុខ។ ប្រសិនបើភាពតានតឹងកើនឡើង វាទំនងជានឹងជំរុញឱ្យតម្លៃប្រេងកើនឡើង ដែលបង្កើនក្តីបារម្ភអំពីអតិផរណា និងដាក់សម្ពាធលើ Fed ឱ្យរក្សាជំហរ Hawkish ក្នុងរយៈពេលយូរជាងមុន។ ស្ថានភាពនេះអាចដាក់សម្ពាធលើតម្លៃមាស។ ផ្ទុយទៅវិញ ប្រសិនបើភាពតានតឹងថយចុះ ឬស្ថានការណ៍នៅតែស្ងប់ស្ងាត់ អតិផរណាអាចនៅតែស្ថិតក្រោមការគ្រប់គ្រង ឬបន្តថយចុះ ដែលនឹងគាំទ្រដល់ការរំពឹងទុកអំពីការកាត់បន្ថយអត្រាការប្រាក់ និងផ្តល់លទ្ធភាពឱ្យតម្លៃមាសកើនឡើងបន្ថែម។
ទោះជាយ៉ាងណា សេណារីយ៉ូដែលយើងរំពឹងទុកជាចម្បង គឺស្ថានការណ៍នឹងនៅតែមានភាពស្ងប់ស្ងាត់។ ដោយសារការបោះឆ្នោតពាក់កណ្តាលអាណត្តិរបស់សហរដ្ឋអាមេរិកនឹងប្រព្រឹត្តទៅនៅខែវិច្ឆិកា រដ្ឋបាល Trump មានហេតុផលច្បាស់លាស់ក្នុងការរក្សាតម្លៃប្រេងសាំងឱ្យទាប និងទីផ្សារឱ្យមានស្ថិរភាព មុនពេលការបោះឆ្នោតមកដល់។ កត្តានេះអាចកាត់បន្ថយលទ្ធភាពនៃការបង្កើនភាពតានតឹងដោយចេតនាពីសហរដ្ឋអាមេរិកក្នុងរយៈពេលខ្លី ទោះបីជាអាចនៅតែមានហេតុការណ៍មួយចំនួនកើតឡើងនៅជុំវិញច្រកសមុទ្រ Hormuz ក៏ដោយ។ ប្រសិនបើស្ថានការណ៍នៅតែបែបនេះ វាអាចបន្តគាំទ្រការរំពឹងទុកអំពី Fed ដែលមានជំហរ Dovish ជាងមុន និងការកាត់បន្ថយអត្រាការប្រាក់បន្ថែម ដែលជាកត្តាគាំទ្រដល់តម្លៃមាស ទោះបីជាតម្រូវការមាសជាទ្រព្យសុវត្ថិភាពដែលកើតចេញពីជម្លោះនេះចាប់ផ្តើមថយចុះក៏ដោយ។
ការវិភាគបច្ចេកទេស (Technical Analysis)
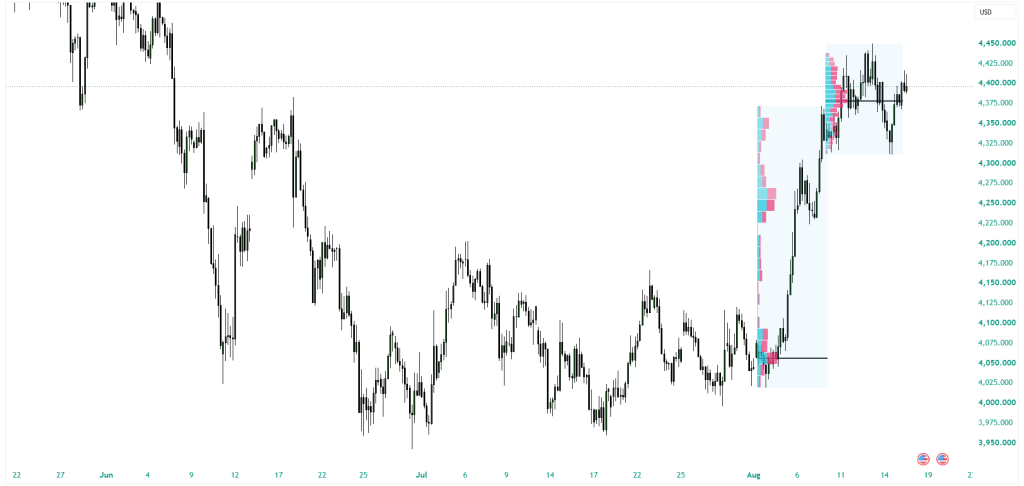
ទិដ្ឋភាពបច្ចេកទេសរបស់ XAU/USD
- ទំនោរបច្ចុប្បន្ន (Current Bias)៖ ឡើងលើ (Bullish) (កំពុងចូលិតដល់កម្រិតអស់កម្លាំងនៅតំបន់ Daily Supply)។
- កម្រិត Resistance ខាងលើ៖ 4446 ដើរតួជាតំបន់ ដែលទីផ្សាររងសម្ពាធ។
- កម្រិតបញ្ច្រាសទិសដៅ (Reversal Pivot)៖ 4332 ដុល្លារ។ ការទម្លុះតម្លៃ និងការឈរជើងបានយ៉ាងរឹងមាំ (sustained break and market acceptance) ក្រោមតម្លៃនេះ បញ្ជាក់ពីការផ្លាស់ប្តូរទម្រង់និន្នាការទៅជាការធ្លាក់ចុះ។
- ផែនការជួញដូរ (Swing Trade Plan)៖ រង់ចាំការបញ្ជាក់ពីការទម្លុះរចនាសម្ព័ន្ធ (structural breakdown) ក្រោមតម្លៃ 4332 មុននឹងអនុវត្តការចូលលក់ (short setups)។
| English Version |
This report highlights key developments for the week ahead, providing investors with relevant context to support informed trading decisions. It covers both fundamental analysis—the primary drivers behind market movements—and technical analysis, including price action and key liquidity zones that traders should monitor.
Disclaimer: This material is provided for educational and informational purposes only and should not be considered as investment advice or a trading signal.
Fundamental Analysis
Four factors to focus on this week from the fundamental side:
Last Week Recap – Economic Data
Last week, key U.S. economic data showed that inflationary pressures remained elevated but did not rise beyond expectations. Annual CPI in July stood at 3.4%, while monthly CPI and monthly Core CPI, which excludes food and energy prices, came in at 0.1% and 0.2%, respectively, both in line with forecasts. Meanwhile, annual Core CPI fell to 2.5%, down from 2.6% in the previous month.
At the same time, monthly PPI remained unchanged at 0.0%, while monthly Core PPI increased by 0.2%, with both figures coming in below forecasts. Toward the end of the week, Retail Sales also declined by 0.6%, while Core Retail Sales fell by 0.3%, both significantly below expectations, pointing to weakness in consumer spending.
Overall, last week’s data provided mixed signals, with inflation not rising beyond expectations, while retail sales data pointed to potentially weakening economic activity.
Fed Rate Hike Expectations are Decreasing
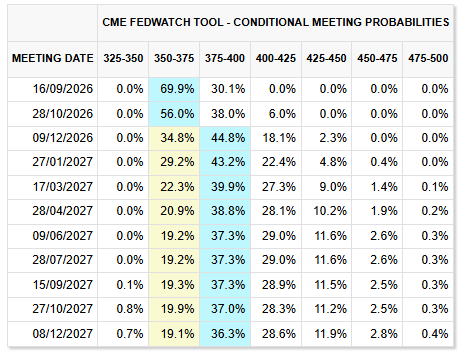
With the next FOMC meeting approximately one month away, expectations surrounding the Fed’s next move have begun to shift. In the past two FOMC meetings, the Fed has maintained a cautious and relatively hawkish stance, holding interest rates while keeping the possibility of further tightening open. However, market expectations have changed significantly. A few weeks ago, the CME FedWatch Tool showed a 25-basis-point rate hike as the most likely outcome for the September FOMC meeting. Today, expectations have shifted significantly, with the CME FedWatch Tool pricing a 69.9% probability of a rate hold and only a 30.1% probability of a September rate hike.
So, what has caused this shift in expectations?
The two main factors are weaker labor-market data and inflation that remains elevated but shows limited signs of further acceleration. Starting with the labor market, U.S. Nonfarm Payrolls have disappointed expectations for two consecutive months, with July’s report being particularly weak. July Nonfarm Payrolls came in at -23K, compared with expectations of +85K, meaning the economy actually lost jobs during the month. This provides the Fed with a stronger reason to be cautious about further tightening, as higher interest rates could place additional pressure on an already weakening labor market.
Inflation, meanwhile, remains elevated but has not shown the acceleration that would strengthen the case for another rate hike. July CPI came in at 3.4% year-over-year, in line with expectations and slightly below June’s 3.5%. More importantly, June CPI had already surprised to the downside at 3.5% versus the 3.8% forecast. July Core CPI also remained relatively contained at 2.5% year-over-year. PPI provided a similar signal, with producer-price data offering little evidence of a renewed acceleration in inflation.
Taken together, the data do not necessarily suggest that inflation has been defeated since the Fed’s 2% target remains some distance away. However, inflation is not accelerating while the labor market is showing signs of weakening. This combination reduces the urgency for the Fed to remain aggressively hawkish, particularly because another rate hike could put additional pressure on economic activity and employment. It would therefore be premature to call this a clear shift from hawkish to dovish policy, but there are increasingly visible signs that the balance of risks is moving in a less hawkish direction. For gold, a continued decline in rate-hike expectations could provide a supportive fundamental backdrop, particularly if upcoming labor-market and inflation data reinforce this trend.
This Week’s Economic Calendar Events
This week’s economic calendar is relatively light, but several key releases could still influence currency and gold markets. The week begins with UK CPI and EU CPI, which will provide fresh insight into inflation trends and could shape expectations for the Bank of England and European Central Bank’s monetary policy. Attention then turns to the FOMC Meeting Minutes, which could offer further clues about the Federal Reserve’s policy outlook and the path of U.S. interest rates. Later in the week, US Initial Jobless Claims will provide an update on labor-market conditions, while the Preliminary US S&P Global Manufacturing & Services PMI will offer an early indication of the health of U.S. economic activity. Together, these releases could influence expectations for central-bank policy and drive volatility across the GBP, EUR, USD, and gold markets.
US-Iran MoU Officially Expires: What Next?
The 60-day deadline for the US and Iran to reach a wider agreement to end their conflict expired without a final deal. The Memorandum of Understanding signed by Trump and Iranian President Masoud Pezeshkian on June 17 and mainly brokered by Pakistan, with Qatar, Saudi Arabia, Turkey and Egypt also involved, included plans to reopen the Strait of Hormuz, ease some financial restrictions on Iran, and set expectations for talks over Iran’s nuclear program. This created a 60-day window for both sides to work toward a permanent deal.
That 60-day window officially ended this week, with no indication so far that either side will extend the agreement. This comes after both sides spent recent weeks exchanging fire and accusing each other of violating the agreement. Iranian Foreign Minister Abbas Araghchi said in a weekend Telegram post that Iran has “not yet made a decision to restart negotiations with the United States.” However, he added that Iran is working on a separate and narrower agreement with Oman on new shipping routes through the Strait of Hormuz, which would depend on a political solution first. On the US side, Trump told supporters in New York that the US would soon “claim” the strait for itself, with similar comments elsewhere about “declaring the Hormuz strait a territory of the United States.”
Control of the strait remains the main point of disagreement, leaving the nearly six-month-old conflict unresolved. The prolonged standoff has already shaken markets and pushed up oil prices.
With interest rate expectations still the main factor driving gold right now, the path forward matters most through its impact on inflation and Fed policy rather than safe-haven demand alone. Further escalation would likely push oil prices higher, raising inflation concerns and putting pressure on the Fed to remain hawkish for longer. This could weigh on gold. De-escalation or continued calm, on the other hand, could allow inflation to remain contained or cool further, supporting the case for rate cuts and giving gold more room to rise. Our base case, however, leans toward calm. With the US midterm elections in November, the Trump administration has a clear incentive to keep gas prices low and markets stable heading into the vote. This could reduce the likelihood of deliberate US escalation in the near term, even if occasional incidents around the strait continue. If this remains the case, it could continue to support expectations for a more dovish Fed and further rate cuts, which would be supportive for gold even as the safe-haven premium from the conflict itself fades.
Technical Analysis
- Current Bias: Bullish (approaching exhaustion at the Daily Supply zone).
- Upper Resistance: 4446, acting as a key zone where the market faces selling pressure.
- Reversal Pivot: $4332. A sustained break and market acceptance below this level confirms a shift in trend structure to bearish.
- Swing Trade Plan: Wait for confirmation of a structural breakdown below 4332 before executing short setups.