
ការបដិសេធ (Disclaimer): ព័ត៌មានទាំងអស់ដែលបង្ហាញគឺសម្រាប់ក្នុងគោលបំណងអប់រំតែប៉ុណ្ណោះ ហើយមិនគួរត្រូវប្រើប្រាស់ជាដំបូន្មានហិរញ្ញវត្ថុ ឬការណែនាំសម្រាប់ការសម្រេចចិត្តលើការជួញដូរ ឬការវិនិយោគនោះទេ។
អ្វីដែលបានកំណត់ទីផ្សារក្នុងត្រីមាសទី 3 និងអ្វីដែលត្រូវយកចិត្តទុកដាក់ក្នុង ត្រីមាសទី 4
ទីផ្សារហិរញ្ញវត្ថុសកលបានបញ្ចប់ត្រីមាសទី 3 ក្នុងបរិយាកាសម៉ាក្រូសេដ្ឋកិច្ចដ៏លំបាកមួយ ប៉ុន្តែទោះជាយ៉ាងណា ទ្រព្យសកម្មដែលមានហានិភ័យ (Risk Assets) បានបង្ហាញពីភាពធន់គួរឱ្យកត់សម្គាល់។ ទីផ្សារភាគហ៊ុនសកលបានបញ្ចប់ត្រីមាសក្នុងស្ថានភាពរឹងមាំ ដោយទទួលបានការគាំទ្រពីកំណើនសេដ្ឋកិច្ចដែលនៅតែមានភាពធន់ និងប្រាក់ចំណេញរបស់ក្រុមហ៊ុនដែលនៅតែរក្សាបានល្អ។ ការវិនិយោគបន្តក្នុងវិស័យបញ្ញាសិប្បនិម្មិត (AI) ក៏នៅតែជាកត្តាសំខាន់មួយដែលជួយជំរុញសុទិដ្ឋិនិយមរបស់ទីផ្សារ។ ភាពរឹងមាំនេះបានកើតឡើង ទោះបីទីផ្សារកំពុងប្រឈមនឹងកត្តាដាក់សម្ពាធជាច្រើន ដូចជា គោលនយោបាយរូបិយវត្ថុដែលនៅតែមានភាពតឹងរ៉ឹង (Tightening Monetary Policy) តម្លៃថាមពលខ្ពស់ និងអតិផរណាដែលនៅតែបន្តកើតមានក៏ដោយ។ នេះបង្ហាញថា ទីផ្សារនៅតែអាចមើលរំលងសម្ពាធម៉ាក្រូសេដ្ឋកិច្ចក្នុងរយៈពេលខ្លីបាន។
ជាមួយគ្នានេះ ទីផ្សារថាមពលនៅតែទទួលឥទ្ធិពលយ៉ាងខ្លាំងពីការវិវត្តនៃភូមិសាស្ត្រនយោបាយ។ ទាំងប្រេងឆៅ Brent និង WTI បានកើនឡើងក្នុងអំឡុងត្រីមាសទី 3 ខណៈច្រកសមុទ្រ Hormuz នៅតែបិទ ហើយជម្លោះរវាងសហរដ្ឋអាមេរិក និងអ៊ីរ៉ង់មិនទាន់មានដំណោះស្រាយច្បាស់លាស់នៅឡើយ។ ទោះជាយ៉ាងណា សន្ទុះនៃការកើនឡើងតម្លៃប្រេងហាក់ដូចជាចាប់ផ្តើមថយចុះនៅចុងត្រីមាស ដោយទាំង Brent និង WTI បានបង្កើត Upper Wick វែងនៅក្នុងខែសីហា ដែលអាចបង្ហាញពីសម្ពាធលក់កាន់តែខ្លាំងនៅតម្លៃខ្ពស់។
មាសក៏នៅតែជាទ្រព្យសកម្មដែលទទួលបានការចាប់អារម្មណ៍ខ្លាំងក្នុងអំឡុងត្រីមាសនេះ។ លោហៈមានតម្លៃនេះមានសន្ទុះឆ្ពោះទៅរកការកើនឡើងប្រចាំត្រីមាសក្នុងកម្រិតខ្ពស់ ដោយទទួលបានការគាំទ្រពីតម្រូវការទីផ្សារ និងការផ្លាស់ប្តូរការរំពឹងទុកចំពោះគោលនយោបាយរូបិយវត្ថុ។ ទោះជាយ៉ាងណា ការកើនឡើងនៃអត្រាផលចំណេញមូលបត្របំណុលអាមេរិក (Treasury Yields) និងការដំឡើងអត្រាការប្រាក់ជាថ្មីដោយធនាគារកណ្តាលមួយចំនួន ជាពិសេសក្នុងខែកញ្ញា បានបង្កើតសម្ពាធយ៉ាងខ្លាំងលើមាសនិងបានកាត់បន្ថយចំណែកមួយនៃការកើនឡើងដែលមាសបានប្រមូលផ្តុំនៅដើមត្រីមាស។
នៅក្នុងទីផ្សាររូបិយប័ណ្ណ USD/JPY នៅតែជាគូរូបិយប័ណ្ណដ៏សំខាន់មួយដែលត្រូវបានតាមដានយ៉ាងជិតស្និទ្ធ ដោយមានការប្រែប្រួលឡើងចុះយ៉ាងខ្លាំងក្នុងអំឡុងត្រីមាសទី 3។ គូរូបិយប័ណ្ណនេះបានឡើងដល់កម្រិតខ្ពស់ 163.991 មុនពេលបិទខែកញ្ញានៅ 157.350។ ភាពទន់ខ្សោយជាបន្តបន្ទាប់របស់ប្រាក់យ៉េនជប៉ុន ភាគច្រើនបណ្តាលមកពីគម្លាតអត្រាការប្រាក់ដ៏ធំរវាងធនាគារកណ្តាលជប៉ុន (BoJ) និងធនាគារកណ្តាលអាមេរិក (Fed) ខណៈការព្រួយបារម្ភអំពីការធ្វើអន្តរាគមន៍ក្នុងទីផ្សាររូបិយប័ណ្ណរបស់ជប៉ុន បានផ្តល់ការគាំទ្រជាបណ្តោះអាសន្នដល់ប្រាក់យ៉េន និងបង្កឱ្យមានការប្រែប្រួលយ៉ាងខ្លាំងនៅក្នុងគូរូបិយប័ណ្ណនេះ។
ជារួម ត្រីមាសទី 3 ត្រូវបានកំណត់ដោយអតិផរណាដែលនៅតែបន្តមានកម្រិតខ្ពស់ អត្រាផលចំណេញមូលបត្របំណុលអាមេរិក (Treasury Yields) ដែលកើនឡើង និងគោលនយោបាយរូបិយវត្ថុដែលនៅតែមានភាពតឹងរ៉ឹង (Tightening Monetary Policy) ដែលបានបង្កើតបរិយាកាសដ៏លំបាកសម្រាប់ទ្រព្យសកម្មជាច្រើន។ នៅពេលទីផ្សារឈានចូលត្រីមាសទី 4 សំណួរសំខាន់គឺថា តើសម្ពាធទាំងនេះអាចចាប់ផ្តើមថយចុះដែរឬទេ។ ការថយចុះនៃអតិផរណា ការធ្លាក់ចុះនៃ Treasury Yields ការធ្លាក់ចុះនៃតម្លៃថាមពល ឬការផ្លាស់ប្តូរទៅរកគោលនយោបាយរូបិយវត្ថុដែលមានភាពតឹងរ៉ឹងតិចជាងមុន អាចផ្លាស់ប្តូរបរិយាកាសទីផ្សារយ៉ាងមានសារៈសំខាន់។ ផ្ទុយទៅវិញ ប្រសិនបើសម្ពាធទាំងនេះនៅតែបន្ត វាអាចបន្តដាក់សម្ពាធលើមាស ទីផ្សាររូបិយប័ណ្ណ និងទ្រព្យសកម្មដែលមានភាពងាយរងផលប៉ះពាល់ពីហានិភ័យ ខណៈដែលធ្វើឱ្យភាពប្រែប្រួលក្នុងទីផ្សារនៅតែមានកម្រិតខ្ពស់។
ទស្សនវិស័យម៉ាក្រូសេដ្ឋកិច្ចសកល
សេដ្ឋកិច្ចសកលបានឈានចូលត្រីមាសទី 4 ខណៈកំណើនសេដ្ឋកិច្ចនៅតែបង្ហាញពីភាពធន់គួរសម ប៉ុន្តែការរួមបញ្ចូលគ្នារវាងអតិផរណាដែលនៅតែបន្តមានកម្រិតខ្ពស់ តម្លៃថាមពលដែលនៅតែខ្ពស់ និងគោលនយោបាយរូបិយវត្ថុដែលកាន់តែតឹងរ៉ឹង បានបន្តបង្កើតភាពមិនប្រាកដប្រជាចំពោះទស្សនវិស័យសេដ្ឋកិច្ច។
កំណើនសេដ្ឋកិច្ចសហរដ្ឋអាមេរិក
សេដ្ឋកិច្ចសហរដ្ឋអាមេរិកនៅតែជាសេដ្ឋកិច្ចមួយក្នុងចំណោមសេដ្ឋកិច្ចដែលមានលទ្ធផលរឹងមាំជាងគេក្នុងត្រីមាសទី 3។ សន្ទស្សន៍ S&P Global US Composite PMI បានកើនឡើងដល់ 58.4 នៅក្នុងខែកញ្ញា ដែលជាការពង្រីកសកម្មភាពអាជីវកម្មក្នុងវិស័យឯកជនខ្លាំងបំផុតចាប់តាំងពីខែកក្កដា ឆ្នាំ 2021។ ភាពរឹងមាំនៃសកម្មភាពអាជីវកម្មនេះបង្ហាញថា សេដ្ឋកិច្ចសហរដ្ឋអាមេរិកនៅតែមានភាពធន់ បើទោះបីប្រឈមនឹងថ្លៃដើមនៃការខ្ចីប្រាក់ខ្ពស់ និងថ្លៃដើមផលិតកម្មដែលនៅតែខ្ពស់ក៏ដោយ។ ការព្យាករណ៍របស់ Fed នៅក្នុងខែកញ្ញា ក៏បានឆ្លុះបញ្ចាំងពីភាពធន់នេះផងដែរ ដោយការព្យាករណ៍កម្រិតមធ្យមសម្រាប់កំណើន GDP ពិតប្រាកដក្នុងឆ្នាំ 2026 ត្រូវបានបង្កើនដល់ 2.3% ពី 2.2% ក្នុងការព្យាករណ៍ខែមិថុនា។
ទោះជាយ៉ាងណា ភាពរឹងមាំនៃសកម្មភាពសេដ្ឋកិច្ចបានអមជាមួយនឹងសញ្ញានៃសម្ពាធនៅក្នុងផ្នែកផ្សេងទៀតនៃសេដ្ឋកិច្ច។ អតិផរណានៅតែមានកម្រិតខ្ពស់ពេញមួយត្រីមាសទី 3 ដោយស្ថិតនៅខ្ពស់ជាងគោលដៅ 2% របស់ Fed។ CPI ទូទៅបានថយចុះបន្តិចពី 3.5% នៅក្នុងខែមិថុនា មក 3.4% នៅក្នុងខែកក្កដា មុនពេលរក្សានៅ 3.4% ក្នុងខែសីហា។ ទោះបីល្បឿននៃអតិផរណាបានចាប់ផ្តើមមានស្ថិរភាពក៏ដោយ វានៅតែខ្ពស់ជាងគោលដៅរបស់ Fed យ៉ាងមានសារៈសំខាន់ ដែលកំណត់សមត្ថភាពរបស់ធនាគារកណ្តាលក្នុងការបន្ធូរគោលនយោបាយរូបិយវត្ថុយ៉ាងខ្លាំង។
ទីផ្សារការងារក៏បានបង្ហាញសញ្ញានៃការថយចុះសន្ទុះផងដែរ។ អត្រាអត់ការងារធ្វើនៅតែមានកម្រិតទាបគួរសម ដោយផ្លាស់ប្តូរពី 4.1% នៅក្នុងខែកក្កដា និងសីហា មក 4.2% ក្នុងខែកញ្ញា ដែលបង្ហាញថាទីផ្សារការងារនៅតែមានភាពធន់ជារួម។ ទោះជាយ៉ាងណា ការបង្កើតការងារបានចុះខ្សោយនៅចុងត្រីមាស។ ចំនួនការងារក្រៅវិស័យកសិកម្ម (Nonfarm Payrolls) ក្នុងខែកញ្ញា បានកើនឡើងត្រឹមតែ 29,000 ការងារ ខណៈតួលេខដំបូងសម្រាប់ខែកក្កដាដែលបង្ហាញពីការថយចុះ 23,000 ការងារ និងការកើនឡើង 162,000 ការងារក្នុងខែសីហា ត្រូវបានកែសម្រួលជាបន្តបន្ទាប់។ ជារួម ទិន្នន័យទាំងនេះបង្ហាញថា ទីផ្សារការងារកំពុងចាប់ផ្តើមថយចុះសន្ទុះ ទោះបីមិនទាន់មានការធ្លាក់ចុះខ្លាំងក៏ដោយ។
ស្ថានភាពនេះបានបង្កើតតុល្យភាពដ៏ស្មុគស្មាញសម្រាប់ Fed នៅពេលឈានចូលត្រីមាសទី 4។ សកម្មភាពសេដ្ឋកិច្ចនៅតែមានភាពរឹងមាំគ្រប់គ្រាន់ដើម្បីទប់ទល់នឹងគោលនយោបាយរូបិយវត្ថុដែលមានភាពតឹងរ៉ឹង ខណៈទីផ្សារការងារមិនទាន់ចុះខ្សោយគ្រប់គ្រាន់ដើម្បីបង្ខំឱ្យមានការផ្លាស់ប្តូរគោលនយោបាយភ្លាមៗ។ ជាមួយគ្នានេះ អតិផរណានៅតែមានកម្រិតខ្ពស់។ ស្ថានភាពរួមនេះទុកឱ្យ Fed មានលទ្ធភាពបន្តរក្សាគោលនយោបាយរូបិយវត្ថុដែលមានភាពតឹងរ៉ឹង និងអាចដំឡើងអត្រាការប្រាក់បន្ថែម ប្រសិនបើសម្ពាធអតិផរណានៅតែបន្ត។
គោលនយោបាយរបស់ធនាគារកណ្តាល
បរិយាកាសអតិផរណាក៏បានរួមចំណែកដល់ការកើនឡើងនៃនិន្នាការរឹតបន្តឹងគោលនយោបាយរូបិយវត្ថុពីសំណាក់ធនាគារកណ្តាលធំៗមួយចំនួនក្នុងត្រីមាសទី 3។ Fed បានដំឡើងអត្រាការប្រាក់គោលដៅចំនួន 0.25% មក 3.75%–4.00% នៅក្នុងខែកញ្ញា ខណៈ ធនាគារកណ្តាលអឺរ៉ុប (ECB) ក៏បានដំឡើងអត្រាការប្រាក់គោលរបស់ខ្លួនចំនួន 0.25% នៅក្នុងខែកញ្ញាផងដែរ។ ធនាគារកណ្តាលអូស្ត្រាលី (RBA) បានដំឡើងអត្រាការប្រាក់គោលចំនួន 0.25% មក 4.60% នៅចុងខែកញ្ញា ដោយលើកឡើងពីអតិផរណាដែលនៅតែខ្ពស់ និងតម្លៃថាមពលសកលដែលកើនឡើង។ ធនាគារកណ្តាលជប៉ុន (BoJ) ក៏បានបន្តដំណើរការធ្វើឱ្យគោលនយោបាយរូបិយវត្ថុមានលក្ខណៈធម្មតាឡើងវិញជាបន្តបន្ទាប់ ដោយបានដំឡើងអត្រាការប្រាក់នៅក្នុងខែកក្កដា និងខែកញ្ញា។
ធនាគារកណ្តាលមួយចំនួនក្នុងចំណោមនេះ ក៏បានរក្សាជំហរប្រុងប្រយ័ត្ន ឬមាននិន្នាការរឹតបន្តឹង (Hawkish) ចំពោះអតិផរណាផងដែរ។ ការសម្រេចចិត្តរបស់ ECB ក្នុងខែកញ្ញា បានលើកឡើងពីសម្ពាធអតិផរណាដែលបន្តកើតមានពីជម្លោះនៅមជ្ឈិមបូព៌ា។ RBA ក៏បានលើកឡើងពីអតិផរណាដែលនៅតែខ្ពស់ តម្លៃថាមពលដែលកើនឡើង និងសម្ពាធថ្លៃដើមក្នុងស្រុកដែលនៅតែបន្ត នៅពេលដែលខ្លួនដំឡើងអត្រាការប្រាក់ក្នុងខែកញ្ញា។
ការរំពឹងទុករបស់ទីផ្សារក៏ឆ្លុះបញ្ចាំងពីការព្រួយបារម្ភជាបន្តបន្ទាប់ចំពោះអតិផរណានេះផងដែរ។
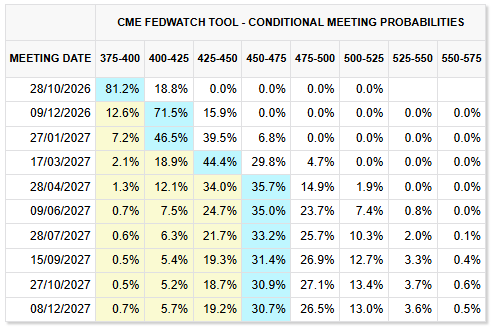
នៅក្នុងត្រីមាសទី 4 ចាប់ផ្តើម ទីផ្សារកំពុងកំណត់តម្លៃចូលទៅក្នុងការរំពឹងទុកខ្ពស់ថា Fed អាចដំឡើងអត្រាការប្រាក់ម្តងទៀតនៅខែធ្នូ ដោយប្រូបាប៊ីលីតេបានកើនឡើងដល់ប្រមាណ 71.5% គិតត្រឹមថ្ងៃទី 7 ខែតុលា។ នេះមានភាពខុសគ្នាពីការរំពឹងទុកសម្រាប់ខែតុលា ដែលប្រូបាប៊ីលីតេនៃការដំឡើងអត្រាការប្រាក់បានធ្លាក់ចុះយ៉ាងខ្លាំង បន្ទាប់ពីរបាយការណ៍ការងារខែកញ្ញាបង្ហាញលទ្ធផលខ្សោយជាងមុន។
ជារួម បរិយាកាសម៉ាក្រូសេដ្ឋកិច្ចសកលនៅពេលឈានចូលត្រីមាសទី ៤ អាចកំណត់លក្ខណៈបានថា កំណើនសេដ្ឋកិច្ចនៅតែមានភាពធន់ ទន្ទឹមនឹងសន្ទុះទីផ្សារការងារដែលកំពុងថយចុះ និងសម្ពាធអតិផរណាដែលនៅតែបន្តមាន។ សំណួរសំខាន់សម្រាប់ត្រីមាសចុងក្រោយនៃឆ្នាំនេះ គឺថា តើអតិផរណាអាចចាប់ផ្តើមថយចុះដោយមិនមានការធ្លាក់ចុះខ្លាំងនៃសកម្មភាពសេដ្ឋកិច្ចដែរឬទេ។ ប្រសិនបើអតិផរណានៅតែមានកម្រិតខ្ពស់ ធនាគារកណ្តាលធំៗអាចបន្ត ឬពង្រីកគោលនយោបាយរូបិយវត្ថុដែលមានភាពតឹងរ៉ឹងរបស់ខ្លួន ដែលអាចរក្សាសម្ពាធគាំទ្រដល់អត្រាផលចំណេញមូលបត្របំណុលអាមេរិក (Treasury Yields) និងប្រាក់ដុល្លារអាមេរិក។ ផ្ទុយទៅវិញ ប្រសិនបើកំណើនសេដ្ឋកិច្ច ឬការងារធ្លាក់ចុះខ្លាំងជាងការរំពឹងទុក វាអាចផ្លាស់ប្តូរការរំពឹងទុករបស់ទីផ្សារទៅរកគោលនយោបាយដែលមានភាពតឹងរ៉ឹងតិចជាងមុន ដែលអាចបង្កើតបរិយាកាសខុសគ្នាយ៉ាងខ្លាំងសម្រាប់រូបិយប័ណ្ណ មាស និងទ្រព្យសកម្មសំខាន់ៗផ្សេងទៀត។
ទស្សនវិស័យមាស
ការវិភាគបែបសេដ្ឋកិច្ច (Fundamental Analysis)
មាសបានបិទត្រីមាសទី 3 ជាមួយនឹងការកើនឡើង 3.56% ប្រចាំត្រីមាស ទោះបីតម្លៃបានកើនឡើងខ្លាំងជាងនេះក្នុងអំឡុងត្រីមាស មុនពេលធ្លាក់ចុះវិញមួយផ្នែកនៅក្នុងខែកញ្ញាក៏ដោយ។ មាសបានកើនឡើងយ៉ាងខ្លាំងនៅក្នុងខែសីហា ប៉ុន្តែការកើនឡើងជាបន្តបន្ទាប់នៃអត្រាផលចំណេញមូលបត្របំណុលអាមេរិក (Treasury Yields) រួមជាមួយការដំឡើងអត្រាការប្រាក់ជាថ្មីដោយធនាគារកណ្តាលធំៗមួយចំនួនក្នុងខែកញ្ញា បានបង្កើតសម្ពាធជាថ្មីលើមាស និងធ្វើឱ្យមាសបាត់បង់ការកើនឡើងមួយផ្នែកធំពីមុន។
នៅពេលឈានចូលត្រីមាសទី 4 កត្តាសេដ្ឋកិច្ចសំខាន់ៗដែលនឹងជំរុញមាស ត្រូវបានរំពឹងថានឹងនៅតែជា តម្លៃប្រេង អតិផរណា គោលនយោបាយរបស់ Fed និងអត្រាផលចំណេញមូលបត្របំណុលអាមេរិក (Treasury Yields)។ កត្តាទាំងនេះមានទំនាក់ទំនងគ្នាយ៉ាងជិតស្និទ្ធ ជាពិសេសតាមរយៈឥទ្ធិពលរបស់តម្លៃថាមពលទៅលើអតិផរណា និងការរំពឹងទុកជាបន្តបន្ទាប់ចំពោះគោលនយោបាយរូបិយវត្ថុ។
ការវិវត្តនៃ ជម្លោះរវាងសហរដ្ឋអាមេរិក និងអ៊ីរ៉ង់ នឹងនៅតែជាកត្តាសំខាន់ដែលត្រូវតាមដាន។ ប្រសិនបើភាពតានតឹងមានភាពធូរស្រាល និងជម្លោះឈានទៅរកដំណោះស្រាយ តម្លៃប្រេងអាចធ្លាក់ចុះ ខណៈការព្រួយបារម្ភអំពីការរំខានដល់ការផ្គត់ផ្គង់ថាមពលថយចុះ។ តម្លៃថាមពលដែលធ្លាក់ចុះអាចជួយកាត់បន្ថយសម្ពាធអតិផរណា និងធ្វើឱ្យការរំពឹងទុកចំពោះការដំឡើងអត្រាការប្រាក់របស់ Fed ម្តងទៀតនៅខែធ្នូថយចុះ។ ជាមួយគ្នានេះ ប្រសិនបើអត្រាផលចំណេញមូលបត្របំណុលអាមេរិក (Treasury Yields) ធ្លាក់ចុះពីកម្រិតបច្ចុប្បន្ន ការរួមបញ្ចូលគ្នារវាងអត្រាផលចំណេញដែលធ្លាក់ចុះ ការរំពឹងទុកអតិផរណាដែលធូរស្រាល និងទស្សនវិស័យគោលនយោបាយរបស់ Fed ដែលមានភាពតឹងរ៉ឹងតិចជាងមុន អាចបង្កើតបរិយាកាសដែលគាំទ្រដល់មាសក្នុងត្រីមាសទី 4។
ផ្ទុយទៅវិញ ប្រសិនបើស្ថានភាពជុំវិញជម្លោះរវាងសហរដ្ឋអាមេរិក និងអ៊ីរ៉ង់មិនមានភាពប្រសើរឡើង តម្លៃប្រេង និងសម្ពាធអតិផរណាអាចនៅតែមានកម្រិតខ្ពស់។ ស្ថានភាពនេះអាចពង្រឹងការរំពឹងទុកថា Fed នឹងបន្តរក្សាគោលនយោបាយរូបិយវត្ថុដែលមានភាពតឹងរ៉ឹង ឬអាចដំឡើងអត្រាការប្រាក់បន្ថែម ខណៈដែលរក្សាឱ្យអត្រាផលចំណេញមូលបត្របំណុលអាមេរិក (Treasury Yields) នៅកម្រិតខ្ពស់។ បរិយាកាសបែបនេះអាចបន្តបង្កើតសម្ពាធលើមាស។
ជារួម ទស្សនវិស័យរបស់មាសសម្រាប់ត្រីមាសទី 4 នឹងពឹងផ្អែកយ៉ាងខ្លាំងលើថាតើសម្ពាធអតិផរណាអាចចាប់ផ្តើមធូរស្រាល និងថាតើអត្រាផលចំណេញមូលបត្របំណុលអាមេរិក (Treasury Yields) អាចធ្លាក់ចុះឬយ៉ាងណា។ ការរួមបញ្ចូលគ្នារវាងតម្លៃប្រេងដែលធ្លាក់ចុះ អតិផរណាដែលធូរស្រាល ការរំពឹងទុកចំពោះការរឹតបន្តឹងគោលនយោបាយរបស់ Fed បន្ថែមដែលថយចុះ និងអត្រាផលចំណេញមូលបត្របំណុលអាមេរិក (Treasury Yields) ដែលធ្លាក់ចុះ នឹងបង្កើតបរិយាកាសសេដ្ឋកិច្ចដែលគាំទ្រដល់មាសកាន់តែខ្លាំង ខណៈសម្ពាធពីតម្លៃថាមពល និងអតិផរណាដែលនៅតែបន្តមាន អាចបន្តកំណត់សន្ទុះកើនឡើងរបស់មាស។
ការវិភាគបច្ចេកទេស (Technical Analysis)
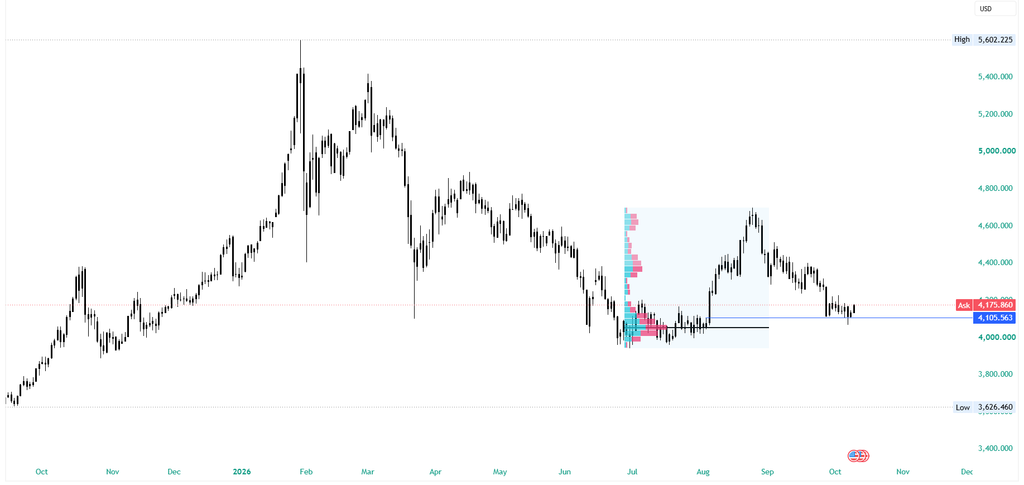
ពេញមួយត្រីមាសទី 3 (Q3) ឆ្នាំ 2026 មាសបានបង្ហាញពីវដ្តនៃការផ្ទុះឡើងខ្លាំង (Expansion) បន្ទាប់មកបានរងការចែកចាយលក់ចេញយ៉ាងគំហុក (Distribution Retracement)។ បន្ទាប់ពីចំណាយពេលពេញមួយខែកក្កដាក្នុងការបង្រួមតម្លៃនៅបាតក្រោម ($3,960 – $4,105) មាសបានផ្ទុះឡើងយ៉ាងខ្លាំងក្នុងខែសីហាឆ្ពោះទៅកាន់តំបន់ផ្គត់ផ្គង់ប្រចាំសប្តាហ៍ $4,694.00 នៅដើមខែកញ្ញា។ សម្ពាធលក់យ៉ាងខ្លាំងនៅចំណុចនោះបានទាញទម្លាក់តម្លៃមកវិញយ៉ាងលឿន ដោយត្រឡប់មកធ្វើតេស្តកម្រិត Weekly POI $4,105.563 មុនពេលងើបឡើងវិញបន្តិចមកកាន់តម្លៃបច្ចុប្បន្ន $4,175.860។
សង្ខេបចលនាតម្លៃក្នុងត្រីមាសទី 3 (កក្កដា – កញ្ញា 2026)
- ការប្រមូលផ្តុំទំហំជួញដូរនៅបាតក្រោម (ខែកក្កដា): បន្ទាប់ពីធ្លាក់ចុះពីកំពូល $5,602.225 មាសបានបង្រួមតម្លៃយ៉ាងតឹងណែននៅតំបន់ Volume Cluster ចន្លោះបាត $4,051.00 ទៅកាន់ $4,105.563។
- សន្ទុះកើនឡើងខ្លាំង (ខែសីហា): ថាមពលដែលបានប្រមូលផ្តុំក្នុងខែកក្កដាបានជំរុញឱ្យមាន Breakout ឡើងលើយ៉ាងខ្លាំង ដោយរុញច្រានតម្លៃកើនឡើងជាច្រើនរយដុល្លារ។
- ការចែកចាយលក់ និងការទាត់ទម្លាក់ (ខែកញ្ញា): ការឡើងថ្លៃបានរងការទាត់ទម្លាក់យ៉ាងគំហុកចេញពី Weekly Resistance & Volume Cluster ត្រង់ $4,694.00។ ការលក់ចេញជាបន្តបន្ទាប់ពេញមួយខែកញ្ញាបានរុញតម្លៃឱ្យធ្លាក់ចុះមកតេស្តតំបន់ Breakout ចាស់នៃ Q3 នៅត្រង់ $4,105.563។
តំបន់បច្ចេកទេសសំខាន់ៗ (Key Technical Zones)
- តម្លៃបច្ចុប្បន្ន (Ask): $4,175.860 — កំពុងស្ថិតក្នុងរលកងើបឡើងវិញរយៈពេលខ្លីចេញពីកម្រិត Support។
- កម្រិតរារាំងខាងលើ (Recent POC): $4,281.93 – $4,300.00 — Point of Control ពីការបង្រួមតម្លៃមុនពេលបំបែកធ្លាក់ចុះ ដែលជាពិតានរារាំងការងើបឡើងវិញភ្លាមៗ។
- កំពូលតម្លៃ Q3 / Weekly Supply: $4,694.00 — កំពូលតម្លៃខ្ពស់បំផុតក្នុងត្រីមាសទី 3 ដែលបានទាត់ទម្លាក់ទីផ្សារមកវិញ។
- កំពូលតម្លៃប្រចាំឆ្នាំ (Macro High): $5,602.225 — កំពូលតម្លៃខ្ពស់បំផុតក្នុងប្រវត្តិសាស្ត្រនៃរលកនេះ។
- កម្រិតទប់ Weekly POI / Support: $4,105.563 — ព្រំដែនខាងលើនៃតំបន់ប្រមូលផ្តុំខែកក្កដា ដែលអ្នកទិញកំពុងការពារយ៉ាងរឹងមាំ។
- កម្រិតទប់បាតចម្បង (Base POC Floor – បន្ទាត់ខ្មៅ): $4,051.00 — តំបន់ Volume Cluster ក្រាស់បំផុតកាលពីខែកក្កដា។
- បាតតម្លៃទាបបំផុត (Macro Low): $3,626.460 — កម្រិតទាបបំផុតប្រចាំឆ្នាំ។
យុទ្ធសាស្ត្រជួញដូរ (Trading Strategy)
- Macro Bearish / Relief Rebound Bias: ទោះបីជានិន្នាការធំពី $5,602 នៅតែជាការធ្លាក់ចុះ ការដែលតម្លៃអាចទប់ជាប់លើ Weekly POI $4,105.563 បានបើកផ្លូវឱ្យមានការងើបឡើងវិញបណ្តោះអាសន្ន (Relief Rally) ឆ្ពោះទៅកាន់តំបន់ Resistance ខាងលើ។
- Relief Rally Scenario: ដរាបណាតម្លៃនៅតែបិទលើ $4,105.563 ការងើបឡើងវិញនេះអាចបន្តទៅធ្វើតេស្តតំបន់ $4,281.93 – $4,300.00។
- Short Continuation Scenario: ប្រសិនបើតម្លៃឡើងដល់តំបន់ $4,281 – $4,300 ហើយជួបប្រទះការរុញច្រានចុះមកវិញ វាជាឱកាសល្អក្នុងការស្វែងរកការចូលលក់ (Short Entries) តាមនិន្នាការធំ។ ផ្ទុយទៅវិញ ប្រសិនបើតម្លៃបំបែកធ្លាក់ចុះក្រោម $4,105.563 យ៉ាងច្បាស់លាស់ ទីផ្សារនឹងបន្តធ្លាក់ចុះទៅកាន់កម្រិតបាត $4,051.00។
ទស្សនវិស័យគូរូបិយប័ណ្ណ USD/JPY
ការវិភាគបែបសេដ្ឋកិច្ច (Fundamental Analysis)
នៅពេលឈានចូលត្រីមាសទី 4 ទស្សនវិស័យរបស់ USD/JPY នឹងនៅតែទទួលឥទ្ធិពលយ៉ាងខ្លាំងពីគម្លាតអត្រាការប្រាក់រវាងសហរដ្ឋអាមេរិក និងជប៉ុន ដោយ គោលនយោបាយរបស់ Fed នៅតែជាកត្តាមូលដ្ឋានដ៏សំខាន់បំផុត។ ទោះបីជាធនាគារកណ្តាលជប៉ុន (BoJ) បានចាប់ផ្តើមផ្លាស់ប្តូរទៅរកគោលនយោបាយរូបិយវត្ថុដែលមានភាពតឹងរ៉ឹងជាងមុនក៏ដោយ អត្រាការប្រាក់របស់សហរដ្ឋអាមេរិកនៅតែខ្ពស់ជាងយ៉ាងខ្លាំង ដែលធ្វើឱ្យគម្លាតអត្រាការប្រាក់រវាងសហរដ្ឋអាមេរិក និងជប៉ុននៅតែធំ និងបន្តគាំទ្រដល់ប្រាក់ដុល្លារអាមេរិកធៀបនឹងប្រាក់យ៉េនជប៉ុន។
ទោះជាយ៉ាងណា កត្តាមួយចំនួនអាចប្រឈមនឹងការគាំទ្រនេះ។ ការធ្លាក់ចុះជាបន្តបន្ទាប់នៃ តម្លៃប្រេង អាចជួយកាត់បន្ថយសម្ពាធអតិផរណា និងធ្វើឱ្យការរំពឹងទុកចំពោះការរឹតបន្តឹងគោលនយោបាយរបស់ Fed បន្ថែមទៀតថយចុះ ជាពិសេសប្រសិនបើការធ្លាក់ចុះនៃតម្លៃថាមពលកើតឡើងស្របពេលជាមួយនឹងការថយចុះនៃសកម្មភាពសេដ្ឋកិច្ចរបស់សហរដ្ឋអាមេរិក។
ជាមួយគ្នានេះ ហានិភ័យនៃការធ្វើអន្តរាគមន៍របស់ជប៉ុន នៅតែជាកត្តាសំខាន់មួយដែលកំណត់ការកើនឡើងរបស់ USD/JPY។ ការធ្វើអន្តរាគមន៍ពីអាជ្ញាធរជប៉ុនកន្លងមកបានបង្ហាញថា ការកើនឡើងទៅជិត ឬលើសកម្រិត 160 អាចបង្កឱ្យមានប្រតិកម្មខ្លាំងនៅក្នុងទីផ្សារ និងរំខានដល់ទំនាក់ទំនងរវាង USD/JPY និង អត្រាផលចំណេញមូលបត្របំណុលអាមេរិក (US Treasury Yields)។ ដូច្នេះ កម្រិតនេះអាចក្លាយជារបាំងសំខាន់មួយសម្រាប់គូរូបិយប័ណ្ណនេះ ទោះបីគម្លាតអត្រាការប្រាក់នៅតែផ្តល់ការគាំទ្រក៏ដោយ។
សម្រាប់ត្រីមាសទី 4 ទិន្នន័យសំខាន់ៗរបស់សហរដ្ឋអាមេរិក រួមមាន CPI, PCE និងទិន្នន័យការងារ (Payrolls) នឹងមានសារៈសំខាន់ជាពិសេសក្នុងការកំណត់ទស្សនវិស័យគោលនយោបាយរបស់ Fed ខណៈទិន្នន័យអតិផរណា ប្រាក់ឈ្នួល និងការទំនាក់ទំនងពី BoJ នឹងមានឥទ្ធិពលលើការរំពឹងទុកចំពោះការដំឡើងអត្រាការប្រាក់បន្ថែមរបស់ជប៉ុន។
ជារួម USD/JPY ឈានចូលត្រីមាសទី 4 ជាមួយនឹងការគាំទ្រជាបន្តបន្ទាប់ពីគម្លាតអត្រាការប្រាក់ដ៏ធំរវាងសហរដ្ឋអាមេរិក និងជប៉ុន ប៉ុន្តែ ហានិភ័យនៃការធ្វើអន្តរាគមន៍ និងលទ្ធភាពនៃការថយចុះនៃអតិផរណា ឬកំណើនសេដ្ឋកិច្ចរបស់សហរដ្ឋអាមេរិក បង្កើតហានិភ័យធ្លាក់ចុះដែលមានសារៈសំខាន់ ដែលបង្ហាញថាទស្សនវិស័យរបស់គូរូបិយប័ណ្ណនេះមានភាពសមតុល្យជាងមុន។
ការវិភាគបច្ចេកទេស (Technical Analysis)
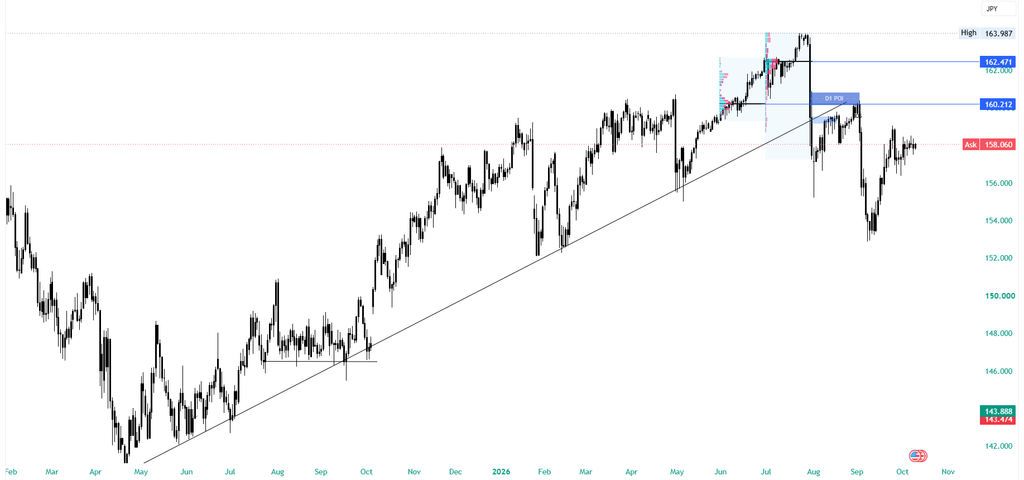
USD/JPY បានបញ្ចប់ត្រីមាសទី 3 (Q3) ឆ្នាំ 2026 ជាមួយនឹងការផ្លាស់ប្តូររចនាសម្ព័ន្ធធំពីការកើនឡើង (Uptrend) ទៅជាការធ្លាក់ចុះយ៉ាងគំហុក (Macro Correction)។ បន្ទាប់ពីឡើងដល់ចំណុចកំពូល 163.987 ក្នុងខែកក្កដា ទីផ្សារបានជួបប្រទះការលក់ចេញយ៉ាងខ្លាំង និងបានបំបែកទម្លុះកម្រិត Support សំខាន់ៗ ដែលរុញតម្លៃឱ្យធ្លាក់ចុះដល់តំបន់ 153.50 មុននឹងមានការងើបឡើងវិញ (Relief Rally) មកកាន់តម្លៃបច្ចុប្បន្ន 158.060។
សង្ខេបចលនាតម្លៃក្នុងត្រីមាសទី 3 (កក្កដា – កញ្ញា 2026)
- ចំណុចកំពូល និងការចែកចាយ (ខែកក្កដា): តម្លៃឡើងដល់ 163.987 ហើយបានប្រមូលផ្តុំទំហំជួញដូរធំនៅជុំវិញ POC 162.471 មុនពេលចាប់ផ្តើមធ្លាក់ចុះ។
- ការបំបែករចនាសម្ព័ន្ធធ្លាក់ចុះ (ខែសីហា): អ្នកលក់បានរុញតម្លៃទម្លុះកម្រិត Support សំខាន់ 160.212 (D1 POI) ព្រមទាំងទម្លុះខ្សែបន្ទាត់ទិសដៅឡើង (Ascending Trendline) ដែលបានទ្រទ្រង់តាំងពីខែឧសភា (~141.50)។
- ការធ្លាក់ដល់បាត និងការងើបឡើងវិញ (ខែកញ្ញា): សន្ទុះធ្លាក់ចុះបានបន្តរហូតដល់តំបន់ 153.50 – 154.00 មុនពេលអ្នកទិញចូលមកទប់ និងរុញតម្លៃឱ្យងើបឡើងវិញបណ្តោះអាសន្នមកកាន់ 158.060។
តំបន់បច្ចេកទេសសំខាន់ៗ (Key Technical Zones)
- តម្លៃបច្ចុប្បន្ន (Ask): 158.060 — កំពុងស្ថិតក្នុងរលកងើបឡើងវិញរយៈពេលខ្លី។
- D1 Point of Interest (POI) / Major Resistance: 160.212 — អតីត Support ដែលប្រែក្លាយជា Resistance ដ៏រឹងមាំ និងជាចំណុចប្រសព្វជាមួយខ្សែ Trendline ដែលបានបំបែកធ្លាក់ចុះ។
- Last Quarter POC: 162.471 — តំបន់ Volume Cluster ខ្ពស់បំផុតក្នុងខែកក្កដា។
- Cycle High: 163.987 — កំពូលតម្លៃខ្ពស់បំផុតក្នុងឆ្នាំ។
- កម្រិតទប់ Q3 Low (Support): 153.500 – 154.000 — បាតតម្លៃនៃខែកញ្ញាដែលបានបញ្ឈប់ការធ្លាក់ចុះនៃ Q3។
យុទ្ធសាស្ត្រជួញដូរ (Trading Strategy)
- Bearish Bias (និន្នាការធំនៅតែធ្លាក់ចុះ): ទោះបីជាមានការងើបឡើងវិញរយៈពេលខ្លីក៏ដោយ ការបំបែក Trendline និងកម្រិត 160.212 បង្ហាញថាអ្នកលក់នៅតែមានប្រៀបក្នុងទិដ្ឋភាពធំ។
Continuation / Pullback Scenario: ប្រសិនបើតម្លៃបន្តងើបឡើងទៅតេស្តតំបន់ 160.00 – 160.212 (D1 POI) នោះគឺជាតំបន់ដែលមានប្រូបាប៊ីលីតេខ្ពស់ក្នុងការស្វែងរកឱកាសចូលលក់ (Short Entries) តាមនិន្នាការធំ។ គោលដៅធ្លាក់ចុះបន្ទាប់គឺ 155.00 និងអាចបន្តទៅកាន់បាត 153.50 – 154.00 ម្តងទៀត។
ទស្សនវិស័យប្រេងឆៅ
ការវិភាគបែបសេដ្ឋកិច្ច (Fundamental Analysis)
នៅពេលឈានចូលត្រីមាសទី 4 ទស្សនវិស័យរបស់ ប្រេងឆៅ នៅតែទទួលឥទ្ធិពលយ៉ាងខ្លាំងពីការវិវត្តនៃភូមិសាស្ត្រនយោបាយ ការរំខានដល់ការផ្គត់ផ្គង់ជាក់ស្តែង និងទិសដៅនៃស្តុកប្រេងសកល។ ជម្លោះរវាងសហរដ្ឋអាមេរិក និងអ៊ីរ៉ង់ និងការរំខាននៅជុំវិញច្រកសមុទ្រ Hormuz នៅតែជាប្រភពនៃភាពមិនប្រាកដប្រជាសំខាន់ៗ ខណៈការវាយប្រហារលើហេដ្ឋារចនាសម្ព័ន្ធថាមពលក្នុងតំបន់ បានធ្វើឱ្យការផ្គត់ផ្គង់ប្រេងឆៅកាន់តែមានកម្រិត។ ដោយសារស្តុកប្រេងសកលកំពុងធ្លាក់ចុះយ៉ាងឆាប់រហ័ស ទស្សនវិស័យចុងក្រោយរបស់ EIA រំពឹងថា តម្លៃប្រេងឆៅ Brent នឹងមានតម្លៃជាមធ្យមប្រហែល $105 ក្នុងមួយបារ៉ែលនៅក្នុងត្រីមាសទី 4 ដែលបង្ហាញពីភាពតឹងតែងបន្តនៅក្នុងទីផ្សារប្រេងឆៅជាក់ស្តែង។
ទីផ្សារប្រេងម៉ាស៊ូត ក៏ជាកត្តាសំខាន់មួយដែលគាំទ្រដល់តម្រូវការប្រេងឆៅផងដែរ។ ការផ្គត់ផ្គង់ប្រេងម៉ាស៊ូតដែលមានភាពតឹងតែងខ្លាំង កំពុងជំរុញឱ្យរោងចក្រចម្រាញ់ប្រេងបង្កើនការផលិតប្រេងម៉ាស៊ូត ដែលបង្កើនតម្រូវការប្រេងឆៅសម្រាប់ជាវត្ថុធាតុដើម។ ជាមួយគ្នានេះ ការរំខានដល់ប្រតិបត្តិការរោងចក្រចម្រាញ់ប្រេង និងការផលិតប្រេងឥន្ធនៈនៅតំបន់ដូចជា រុស្ស៊ី អាចធ្វើឱ្យទីផ្សារផលិតផលប្រេងចម្រាញ់នៅតែមានភាពតឹងតែង ដោយផ្តល់ការគាំទ្របន្ថែមដល់តម្លៃប្រេង ទោះបីការផ្គត់ផ្គង់ប្រេងឆៅចាប់ផ្តើមប្រសើរឡើងជាបន្តបន្ទាប់ក៏ដោយ។
ទោះជាយ៉ាងណា ទស្សនវិស័យនេះក៏មានហានិភ័យធ្លាក់ចុះផងដែរ។ IEA រំពឹងថាតម្រូវការប្រេងសកលនឹងមានភាពទន់ខ្សោយនៅក្នុងឆ្នាំ 2026 ដែលបង្កើនការព្រួយបារម្ភអំពីការថយចុះនៃតម្រូវការ ប្រសិនបើតម្លៃថាមពលនៅតែខ្ពស់។ ទន្ទឹមនឹងនេះ អ្នកផលិត និងអ្នកនាំចេញបានសម្របខ្លួនទៅនឹងការរំខាន ដោយប្រើផ្លូវនាំចេញជំនួស និងវិធីសាស្ត្រផ្សេងៗ ដើម្បីរក្សាលំហូរប្រេង។ ការបន្តប្រសើរឡើងនៃផ្លូវនាំចេញជំនួសទាំងនេះ អាចជួយកាត់បន្ថយសម្ពាធលើការផ្គត់ផ្គង់ជាបន្តបន្ទាប់ និងធ្វើឱ្យ បុព្វលាភភូមិសាស្ត្រនយោបាយ (Geopolitical Premium) របស់តម្លៃប្រេងថយចុះ។
ដូច្នេះ ស្តុកប្រេងនឹងនៅតែជាសូចនាករសំខាន់មួយសម្រាប់ត្រីមាសទី 4។ ការធ្លាក់ចុះបន្ថែមនៃស្តុកប្រេងសកល នឹងពង្រឹងទស្សនៈដែលថាតម្លៃប្រេងអាចនៅតែមានកម្រិតខ្ពស់ ខណៈការស្តារឡើងវិញជាបន្តបន្ទាប់នៃលំហូរប្រេង និងការកើនឡើងនៃស្តុកប្រេងនៅពេលក្រោយ អាចបង្កើនសម្ពាធធ្លាក់ចុះ។ តុល្យភាពរវាងការរំខានដល់ការផ្គត់ផ្គង់ដែលនៅតែបន្ត និងសមត្ថភាពផ្គត់ផ្គង់ដែលកំពុងប្រសើរឡើង នឹងមានសារៈសំខាន់ជាពិសេសក្នុងការកំណត់ទិសដៅទីផ្សារ។
ជារួម ប្រេងឆៅឈានចូលត្រីមាសទី 4 ជាមួយនឹង ការគាំទ្រខ្លាំងក្នុងរយៈពេលខ្លីពីការរំខានផ្នែកភូមិសាស្ត្រនយោបាយ ការធ្លាក់ចុះនៃស្តុកប្រេង និងភាពតឹងតែងនៅក្នុងទីផ្សារប្រេងម៉ាស៊ូត ខណៈតម្រូវការដែលមានភាពទន់ខ្សោយ និងការស្តារឡើងវិញជាបន្តបន្ទាប់នៃផ្លូវនាំចេញជំនួស បង្កើតហានិភ័យធ្លាក់ចុះ។ សំណួរសំខាន់សម្រាប់ត្រីមាសទី 4 គឺថា តើការរំខានដល់ការផ្គត់ផ្គង់ជាក់ស្តែងនឹងនៅតែធ្ងន់ធ្ងរគ្រប់គ្រាន់ដើម្បីលើសពីការប្រសើរឡើងនៃលំហូរផ្គត់ផ្គង់ និងតម្រូវការដែលមានភាពទន់ខ្សោយឬយ៉ាងណា។
ការវិភាគបច្ចេកទេស (Technical Analysis)
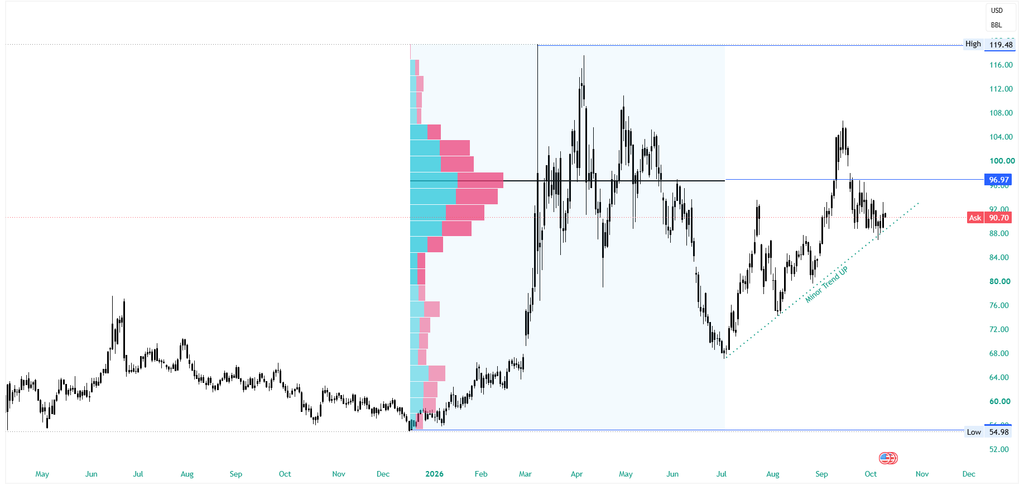
តម្លៃប្រេង USOIL បានបង្ហាញពីការងើបឡើងវិញយ៉ាងខ្លាំងក្លាពេញមួយត្រីមាសទី 3 (Q3) ឆ្នាំ 2026 ដោយបានប្តូរពីការធ្លាក់ចុះយ៉ាងគំហុក ទៅជាទម្រង់កើនឡើងជាបន្តបន្ទាប់ (Ascending Trend)។ បន្ទាប់ពីធ្លាក់ចុះដល់បាត $68.00 នៅដើមខែកក្កដា តម្លៃបានចាប់ផ្តើមហក់ឡើងវិញតាមរយៈខ្សែបន្ទាត់ទម្រង់ឡើង (Minor Trend UP) ដោយបានឡើងទៅដល់ចំណុចកំពូលក្បែរ $106.00 នៅដើមខែកញ្ញា មុនពេលទាញថយក្រោយមកបង្រួមតម្លៃនៅត្រង់កម្រិតបច្ចុប្បន្ន $90.70។
សង្ខេបចលនាតម្លៃក្នុងត្រីមាសទី 3 (កក្កដា – កញ្ញា 2026)
- ការបង្កើតបាត និងការត្រឡប់ទិស (ខែកក្កដា): បន្ទាប់ពីធ្លាក់ចុះយ៉ាងខ្លាំងពីកំពូល $119.48 តម្លៃបានរកឃើញកម្រិតទប់យ៉ាងរឹងមាំនៅ $68.00 ក្នុងដើមខែកក្កដា ដែលជាបាតតម្លៃទាបបំផុតនៃត្រីមាស។
- សន្ទុះកើនឡើងខ្លាំង (ខែសីហា): កម្លាំងទិញបានរុញច្រានតម្លៃឱ្យកើនឡើងយ៉ាងលឿន បង្កើតបានជាខ្សែបន្ទាត់ទិសដៅឡើង Minor Trend UP និងឆ្លងកាត់តំបន់ផ្លូវចិត្ត $80.00 – $90.00។
- ចំណុចកំពូល និងការទាញថយក្រោយ (ខែកញ្ញា): ការឡើងថ្លៃបានរងការរុញច្រាននៅជុំវិញ $106.00 ក្នុងដើមខែកញ្ញា បន្ទាប់មកបានទាញថយក្រោយ (Retracement) ត្រឡប់មកធ្វើតេស្តខ្សែបន្ទាត់ Support Trendline នៅជុំវិញតម្លៃបច្ចុប្បន្ន $90.70។
តំបន់បច្ចេកទេសសំខាន់ៗ (Key Technical Zones)
- តម្លៃបច្ចុប្បន្ន (Ask): $90.70 — កំពុងស្ថិតនៅលើខ្សែបន្ទាត់ទ្រទ្រង់ Minor Trend UP ផ្ទាល់។
- កម្រិតរារាំងសំខាន់ (POC): $96.97 — ជាកម្រិត Point of Control នៃទំហំជួញដូរធំពីមុន ដែលជាឧបសគ្គរារាំងចម្បងខាងលើ។
- កម្រិតរារាំង Q3 High: $106.00 — កំពូលតម្លៃនៃខែកញ្ញា និងជាគោលដៅរំពឹងទុកដំបូងសម្រាប់ការងើបឡើងបន្ត។
- កំពូលតម្លៃប្រចាំឆ្នាំ (Cycle High): $119.48 — កំពូលតម្លៃខ្ពស់បំផុតក្នុងឆ្នាំ 2026។
- ខ្សែបន្ទាត់ទ្រទ្រង់ (Dynamic Support): ~$88.00 – $90.00 — ខ្សែបន្ទាត់ Minor Trend UP ដែលតភ្ជាប់ពីបាតខែកក្កដា។ ដរាបណាតម្លៃនៅឈរលើបន្ទាត់នេះ រចនាសម្ព័ន្ធកើនឡើងនៅតែមានសុពលភាព។
- កម្រិតទប់បាត Q3 Low: $68.00 — បាតតម្លៃនៃខែកក្កដា ដែលជាចំណុចចាប់ផ្តើមនៃការកើនឡើងក្នុងត្រីមាសទី 3។
យុទ្ធសាស្ត្រជួញដូរ (Trading Strategy)
- Intermediate Bullish Bias (ទំនោរកើនឡើងតាម Trendline): ទោះបីជាមានការទាញថយក្រោយពីកំពូល $106.00 ក៏ដោយ និន្នាការធំចាប់ពីខែកក្កដាមកនៅតែស្ថិតក្នុងទម្រង់ឡើង (Bullish Structure) ដរាបណាតម្លៃអាចការពារខ្សែបន្ទាត់ Minor Trend UP បាន។
- Trendline Bounce Scenario: ប្រសិនបើអ្នកទិញអាចរក្សាជំហរនៅលើតំបន់ $88.00 – $90.70 ទីផ្សារមានប្រូបាប៊ីលីតេខ្ពស់ក្នុងការលោតងើបឡើងទៅតេស្ត $96.97 (POC) និងអាចបន្តឆ្ពោះទៅកាន់ $106.00។
- Breakdown Scenario: ប្រសិនបើតម្លៃបំបែកធ្លាក់ចុះក្រោម $88.00 យ៉ាងច្បាស់លាស់ នោះទម្រង់កើនឡើងនឹងត្រូវបានមោឃភាព ហើយតម្លៃអាចនឹងធ្លាក់ចុះជ្រៅទៅកាន់ $82.00 ឬតេស្តតំបន់បាតចាស់ $68.00 ម្តងទៀត។
សេចក្តីសន្និដ្ឋាន
ត្រីមាសទី 4 ឆ្នាំ 2026 ចាប់ផ្តើមនៅក្នុងបរិបទដែលទីផ្សារកំពុងប្រឈមមុខនឹងតុល្យភាពដ៏ប្រុងប្រយ័ត្នរវាង កំណើនសេដ្ឋកិច្ចដែលនៅតែមានភាពធន់ អតិផរណាដែលនៅតែបន្តមាន និងហានិភ័យភូមិសាស្ត្រនយោបាយដែលកំពុងបន្ត។ សេដ្ឋកិច្ចសហរដ្ឋអាមេរិកនៅតែមានភាពរឹងមាំក្នុងកម្រិតមួយ ប៉ុន្តែសញ្ញានៃការថមថយនៃសន្ទុះទីផ្សារការងារ អាចក្លាយជាកត្តាសំខាន់កាន់តែខ្លាំង ប្រសិនបើនិន្នាការនេះបន្តរហូតដល់ចុងឆ្នាំ។ ជាមួយគ្នានេះ អតិផរណានៅតែស្ថិតនៅខ្ពស់ជាងគោលដៅរបស់ Fed ដែលធ្វើឱ្យគោលនយោបាយរូបិយវត្ថុនៅតែមានលក្ខណៈតឹងរ៉ឹង និងធ្វើឱ្យ អត្រាផលចំណេញមូលបត្របំណុលអាមេរិក (Treasury Yields) និងប្រាក់ដុល្លារអាមេរិកមានភាពងាយរងឥទ្ធិពលពីទិន្នន័យសេដ្ឋកិច្ចថ្មីៗ។
សម្រាប់ប្រភេទទ្រព្យសកម្មសំខាន់ៗ ទស្សនវិស័យនឹងពឹងផ្អែកយ៉ាងខ្លាំងលើការវិវត្តនៃកត្តាដែលប្រកួតប្រជែងគ្នាទាំងនេះ។ មាស អាចទទួលបានការគាំទ្រពីការថមថយនៃអតិផរណា ការធ្លាក់ចុះនៃអត្រាផលចំណេញមូលបត្របំណុលអាមេរិក និងការថយចុះនៃការរំពឹងទុកចំពោះការរឹតបន្តឹងគោលនយោបាយរូបិយវត្ថុបន្ថែមរបស់ Fed ខណៈដែលអតិផរណាដែលបណ្តាលមកពីថ្លៃថាមពលនៅតែបន្ត អាចកំណត់សក្តានុពលនៃការកើនឡើងរបស់មាស។ ចំពោះគូរូបិយប័ណ្ណ USD/JPY វានៅតែទទួលបានការគាំទ្រពីភាពខុសគ្នាខ្ពស់នៃអត្រាការប្រាក់រវាងសហរដ្ឋអាមេរិក និងជប៉ុន ប៉ុន្តែហានិភ័យនៃការធ្វើអន្តរាគមន៍ និងលទ្ធភាពដែលទិន្នន័យសេដ្ឋកិច្ចសហរដ្ឋអាមេរិកចុះខ្សោយ អាចបង្កើតហានិភ័យធ្លាក់ចុះគួរឱ្យកត់សម្គាល់។ ចំណែកប្រេងឆៅចូលទៅក្នុងត្រីមាសទី 4 ជាមួយនឹងការគាំទ្រខ្លាំងក្នុងរយៈពេលខ្លី ពីការរំខានផ្នែកភូមិសាស្ត្រនយោបាយ ការធ្លាក់ចុះនៃស្តុកប្រេង និងភាពតឹងតែងនៅក្នុងទីផ្សារប្រេងម៉ាស៊ូត ទោះបីជាការធ្វើឱ្យផ្លូវផ្គត់ផ្គង់មានភាពប្រសើរឡើង និងតម្រូវការដែលចុះខ្សោយ អាចជួយបន្ធូរបន្ថយសម្ពាធទាំងនេះនៅពេលក្រោយក៏ដោយ។
ជារួម ប្រធានបទសំខាន់សម្រាប់ត្រីមាសទី 4 នឹងផ្តោតលើថាតើ សម្ពាធអតិផរណា និងភូមិសាស្ត្រនយោបាយអាចថមថយចុះ ដោយមិនបង្កឱ្យមានការធ្លាក់ចុះខ្លាំងនៃកំណើនសេដ្ឋកិច្ចពិភពលោកឬអត់។ ការរួមបញ្ចូលគ្នារវាងថ្លៃថាមពលដែលធ្លាក់ចុះ អតិផរណាដែលថមថយ និងគោលនយោបាយរូបិយវត្ថុដែលមានភាពតឹងរ៉ឹងតិចជាងមុន អាចបង្កើតបរិយាកាសដែលមានភាពអំណោយផលជាងមុនសម្រាប់ទីផ្សារហិរញ្ញវត្ថុ។ ផ្ទុយទៅវិញ អតិផរណាដែលនៅតែបន្តមាន ថ្លៃថាមពលខ្ពស់ និងការរំខានដល់ការផ្គត់ផ្គង់ដែលនៅតែបន្ត អាចធ្វើឱ្យធនាគារកណ្តាលបន្តមានភាពប្រុងប្រយ័ត្ន រក្សាឱ្យ អត្រាផលចំណេញមូលបត្របំណុលអាមេរិក (Treasury Yields) ស្ថិតនៅកម្រិតខ្ពស់ និងធ្វើឱ្យភាពប្រែប្រួលនៃទីផ្សារនៅតែខ្ពស់។
ជាលទ្ធផល ត្រីមាសទី 4 ទំនងជានឹងនៅតែមានភាពងាយរងឥទ្ធិពលខ្លាំងពី ទិន្នន័យសេដ្ឋកិច្ច ការប្រាស្រ័យទាក់ទងរបស់ធនាគារកណ្តាល និងការវិវត្តនៃភូមិសាស្ត្រនយោបាយ ដែលធ្វើឱ្យទំនាក់ទំនងរវាងកត្តាទាំងនេះមានសារៈសំខាន់ជាពិសេសចំពោះទិសដៅនៃរូបិយប័ណ្ណសំខាន់ៗ និងប្រភេទទ្រព្យសកម្មផ្សេងៗទៀត។
| English Version |
Introduction: What Defined Q3 and What Matters for Q4
Global markets ended Q3 against a challenging macroeconomic backdrop, yet risk assets showed notable resilience. Global equity markets finished the quarter strongly, supported by resilient economic growth and relatively solid corporate earnings, with continued investment in artificial intelligence remaining an important source of optimism. This strength came despite several headwinds, including restrictive monetary policy, elevated energy prices and persistent inflation, highlighting the market’s ability to look beyond near-term macroeconomic pressures.
Energy markets, meanwhile, remained heavily influenced by geopolitical developments. Both Brent and WTI crude oil rallied throughout Q3 as the Strait of Hormuz remained closed and the conflict between the US and Iran showed no clear path toward resolution. However, the pace of the oil rally appeared to lose some momentum toward the end of the quarter, with both Brent and WTI forming large upper wicks in August, suggesting growing selling pressure at higher price levels.
Gold also remained a major focus throughout the quarter. The precious metal was on track for a substantial quarterly gain, supported by broader demand for the asset and shifting expectations around monetary policy. However, rising Treasury Yields and renewed interest-rate hikes by central banks, particularly in September, created significant headwinds for Gold and reduced some of the gains accumulated earlier in the quarter.
In the currency market, USD/JPY remained one of the most closely watched major pairs, experiencing significant two-way volatility throughout Q3. The pair reached a high of 163.991 before closing September at 157.350. The Japanese Yen’s persistent weakness was largely driven by the wide interest-rate differential between the Bank of Japan (BoJ) and the US Federal Reserve (Fed), while concerns over potential intervention periodically provided temporary support for the Yen and contributed to sharp reversals in the pair.
Overall, Q3 was characterized by persistent inflation, elevated Treasury Yields and restrictive monetary policy—an environment that created significant challenges across many asset classes. As markets enter Q4, the key question is whether these pressures can begin to ease. A moderation in inflation, lower Treasury Yields, softer energy prices or a shift toward less restrictive monetary policy could significantly change the market environment. Conversely, if these pressures persist, they could continue to weigh on Gold, currencies and other risk-sensitive assets while keeping volatility elevated.
Global Macro Outlook
The global economy entered Q4 with growth remaining relatively resilient, but the combination of persistent inflation, elevated energy prices and tighter monetary policy continues to create uncertainty over the outlook.
US Economic Growth
The US economy remained one of the stronger performers in Q3. The S&P Global US Composite PMI rose to 58.4 in September, marking the strongest expansion in private-sector business activity since July 2021. The strength of business activity suggests that the US economy has so far remained resilient despite higher borrowing costs and elevated input prices. The Federal Reserve’s September projections also reflected this resilience, with the median forecast for 2026 real GDP growth raised to 2.3%, up from 2.2% in its June projections.
However, the resilience of economic activity has been accompanied by signs of pressure elsewhere in the economy. Inflation remained elevated throughout Q3, staying well above the Fed’s 2% target. Headline CPI eased slightly from 3.5% in June to 3.4% in July before holding at 3.4% in August. While the pace of inflation has stabilized, it remains significantly above the Fed’s target, limiting the central bank’s ability to ease policy aggressively.
The labor market also showed signs of losing momentum. The unemployment rate remained relatively low, moving from 4.1% in July and August to 4.2% in September, indicating that the labor market remained broadly resilient. However, job creation weakened toward the end of the quarter. September payrolls increased by only 29,000, while July’s initial decline of 23,000 and August’s 162,000 gain were later subject to revisions. Taken together, the data suggest that the labor market is cooling, even if it has not yet deteriorated sharply.
This creates a delicate balance for the Fed heading into Q4. Economic activity remains strong enough to withstand restrictive policy, while the labor market has not weakened enough to force an immediate policy reversal. At the same time, inflation remains elevated. This combination leaves the Fed with room to maintain a restrictive stance and potentially raise rates further if inflationary pressures persist.
Central Bank Policy
The inflationary environment also contributed to a renewed tightening bias among several major central banks during Q3. The Fed raised its target range by 25 basis points to 3.75%–4.00% in September, while the ECB also increased its key rates by 25 basis points in September. The Reserve Bank of Australia raised its cash rate by 25 basis points to 4.60% at the end of September, citing elevated inflation and higher global energy prices. The Bank of Japan also continued its gradual policy normalization, raising rates in both July and September.
Several of these central banks have also maintained a cautious or hawkish stance on inflation. The ECB’s September decision cited ongoing inflationary pressures from the Middle East conflict. The RBA similarly highlighted elevated inflation, higher energy prices and persistent domestic cost pressures when it raised rates in September.
Market expectations reflect this continued concern over inflation.
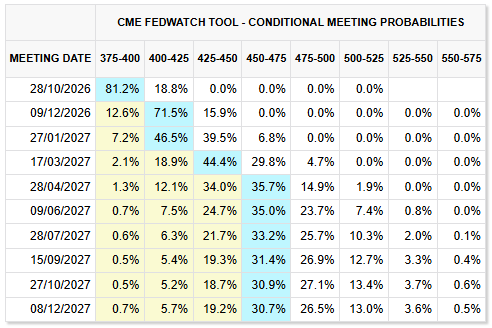
As Q4 begins, markets are pricing in a high probability of another Fed rate hike in December, with the probability reaching around 71.5% as of October 7. This contrasts with expectations for October, where the probability of a hike had fallen sharply following the weaker September employment report.
Overall, the global macroeconomic backdrop entering Q4 can be characterized as resilient growth alongside slowing labor-market momentum and persistent inflationary pressure. The key question for the final quarter will be whether inflation begins to moderate without a more significant deterioration in economic activity. If inflation remains elevated, major central banks may maintain or extend their restrictive policy stance, keeping Treasury Yields and the US dollar supported. However, a sharper slowdown in growth or employment could eventually shift expectations toward less restrictive policy, creating a very different environment for currencies, Gold and other major asset classes.
Gold Outlook
Fundamental Analysis
Gold closed Q3 with a 3.56% quarterly gain, although the metal experienced significantly stronger gains during the quarter before giving back part of its advance in September. Gold initially rallied strongly in August, but the subsequent rise in Treasury Yields, combined with another interest rate hike by several major central banks in September, placed renewed pressure on the metal and reduced a significant portion of its earlier gains.
Heading into Q4, the key fundamental drivers for Gold are expected to remain oil prices, inflation, Fed policy and Treasury Yields. These factors are closely connected, particularly through the impact of energy prices on inflation and the resulting expectations for monetary policy.
The development of the US-Iran conflict will therefore remain an important factor to monitor. If tensions improve and the conflict moves toward a resolution, oil prices could come under downward pressure as concerns over energy supply disruptions ease. Lower energy prices could, in turn, reduce inflationary pressures and weaken expectations for another Fed rate hike in December. At the same time, if Treasury Yields decline from their current levels, the combination of lower yields, softer inflation expectations and a less restrictive outlook for Fed policy could create a more supportive environment for Gold in Q4.
However, if the situation surrounding the US-Iran conflict does not improve, oil prices and inflationary pressures could remain elevated. This could reinforce expectations that the Fed will maintain a restrictive policy stance or potentially raise rates further, while keeping Treasury Yields elevated. Such an environment could create continued headwinds for Gold.
Overall, Gold’s Q4 outlook will depend heavily on whether inflationary pressures begin to ease and whether Treasury Yields can move lower. A combination of lower oil prices, moderating inflation, reduced expectations for further Fed tightening and declining Treasury Yields would provide a more supportive fundamental backdrop for Gold, while persistent energy and inflationary pressures could continue to limit its upside.
Technical Analysis
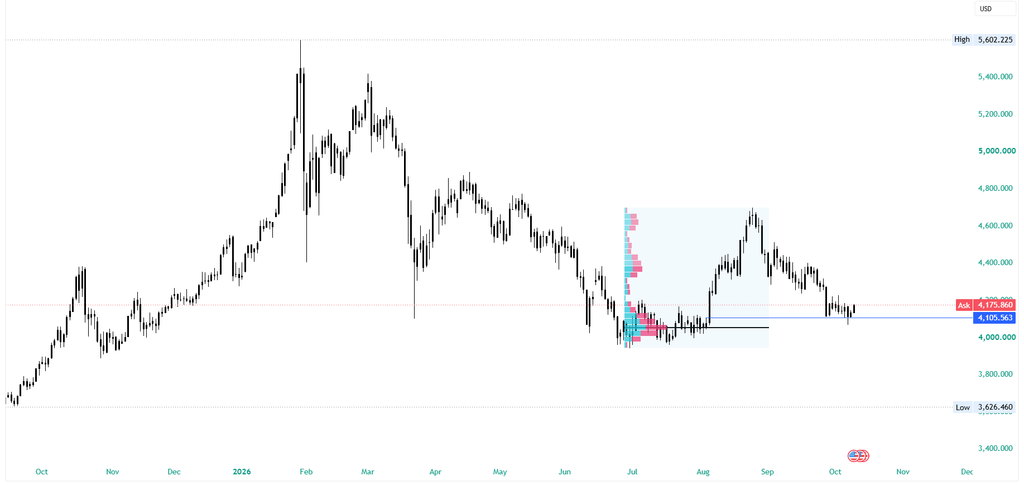
Throughout Q3 2026, Gold experienced an aggressive expansion cycle followed by a full-scale distribution retracement. After spending July compressing tightly near the lower range ($3,960 – $4,105), price initiated a powerful August expansion up toward the $4,694.00 weekly supply zone in early September. Heavy distribution at that peak subsequently triggered a steep rollover, returning price directly back to test the primary accumulation base and the $4,105.563 Weekly Point of Interest (POI) before posting the current bounce to $4,175.860.
Q3 Price Action Recap (July – September 2026)
- July Base Compression ($3,960 – $4,105): Following a steep multi-month markdown from the macro high of $5,602.225, Gold consolidated into heavy volume accumulation throughout July, building energy between the $4,051.00 floor and the $4,105.563 pivot.
- August Expansion Surge: Stored energy from the July base resolved into an aggressive upside breakout, clearing multiple resistance tiers and driving price through an multi-hundred-dollar impulse.
- September Distribution & Rejection ($4,694.00): The rally met institutional supply at the $4,694.00 high-volume cluster in early September. Failure to sustain higher prices triggered an aggressive liquidation through mid-to-late September, bringing the market back down to retest the original Q3 breakout shelf at $4,105.563.
Key Technical Zones
- Current Price (Ask): $4,175.860 — Experiencing a relief bounce off the primary weekly demand floor.
- Immediate Resistance / Overhead Supply: $4,281.93 – $4,300.00 — The Point of Control from late-September consolidation before the final breakdown leg. Serves as the primary ceiling for short-term relief rallies.
- Q3 Local Top / Weekly Supply Zone: $4,694.00 — The cycle distribution high that halted the Q3 rally and triggered the multi-week sell-off.
- Cycle Macro High: $5,602.225 — The overarching macro peak.
- Weekly Point of Interest (POI) / Key Support: $4,105.563 — The critical upper boundary of the July accumulation cluster. Buyers have defended this shelf to establish the current rebound.
- Major Base Floor / Accumulation POC (Black Line): $4,051.00 — The ultimate structural support floor from July’s high-volume block.
- Cycle Macro Low: $3,626.460 — The long-term multi-month floor.
Trading Strategy & Outlook
- Macro Bearish / Relief Rebound Bias: While the broader market remains within a macro downtrend from $5,602, the successful defense of the $4,105.563 Weekly POI keeps a short-term relief bounce active toward overhead supply.
- Relief Rally Scenario (Upside Target): As long as the $4,105.563 POI holds on a daily closing basis, the corrective push can extend higher to retest the $4,281.93 overhead supply cluster.
- Short Continuation Scenario: If price reaches the $4,281 – $4,300 resistance block and displays rejection candles, it offers high-probability setups to rejoin the dominant macro trend. Conversely, a decisive breakdown below $4,105.563 opens the door for a retest of the $4,051.00 accumulation floor.
USD/JPY Outlook
Fundamental Analysis
Heading into Q4, the outlook for USD/JPY will remain heavily influenced by the interest rate differential between the United States and Japan, with Fed policy continuing to be the dominant fundamental driver. Despite the BoJ’s recent shift toward tighter monetary policy, US interest rates remain significantly higher, keeping the US–Japan rate differential wide and providing continued support for the US dollar against the Japanese Yen.
However, several factors could challenge this support. A sustained decline in oil prices could ease inflationary pressures and reduce expectations for further Fed tightening, particularly if lower energy costs are accompanied by weaker US economic activity.
At the same time, Japanese intervention risk remains an important constraint on USD/JPY. Previous intervention by Japanese authorities has demonstrated that moves toward or above 160 can trigger significant market reactions and disrupt the relationship between USD/JPY and US yields. This creates an important ceiling for the pair even if the underlying rate differential remains supportive.
For Q4, key US releases including CPI, PCE, and payrolls will be particularly important in determining the Fed’s policy outlook, while Japanese inflation, wages and BoJ communication will influence expectations for further rate hikes.
Overall, USD/JPY enters Q4 with continued fundamental support from the wide US–Japan rate differential, but intervention risk and the potential for weaker US inflation or growth create meaningful downside risks, suggesting a more balanced outlook for the pair.
Technical Analysis
USD/JPY closed out Q3 2026 with a decisive structural shift from a multi-month bull run into an aggressive macro correction. After reaching a cycle peak of 163.987 in July, heavy distribution and a breakdown below key support structures altered the higher-timeframe trajectory, pulling the pair down toward 153.50 before a late-quarter relief rebound to the current 158.060 level.
Q3 Price Action Recap (July – September 2026)
- July Peak & Distribution (163.987): The market posted its cycle top at 163.987 before establishing heavy volume consolidation around the 162.471 Point of Control (POC). Exhaustion at these highs triggered aggressive institutional selling.
- August Structural Breakdown (D1 POI & Trendline): Sellers forced price through the 160.212 support floor (Daily POI) and broke below the multi-month ascending trendline that guided price action since the May lows (~141.50).
- September Flush & Relief Rally: Downside momentum accelerated toward the 153.50 – 154.00 liquidity zone in September. Buyers stepped in to defend this base, initiating the current multi-week corrective bounce back toward 158.060.
Key Technical Zones
- Current Price (Ask): 158.060 — Consolidating in the upper half of the post-drop recovery leg, approaching overhead technical resistance.
- D1 Point of Interest (POI) / Key Resistance: 160.212 — Former primary support turned major overhead resistance. This level aligns with the underside retest of the broken ascending trendline, creating a high-probability supply cluster.
- Q3 High-Volume POC: 162.471 — The Point of Control from July’s distribution top. Acts as the ultimate invalidation pivot for macro bearish structure.
- Cycle High: 163.987 — The macro peak and key liquidity high.
- Immediate Support / Q3 Low: 153.500 – 154.000 — The September swing-low floor that halted the Q3 sell-off.
- Macro Demand Floor: 146.500 – 148.000 — The major horizontal accumulation base from mid-2026.
Trading Strategy & Outlook
- Macro Bearish / Corrective Relief Bias: The broader trend structure remains bearish following the loss of the ascending trendline and the 160.212 structural pivot. However, short-term momentum is currently corrective (relief rally).
- Pullback / Re-test Scenario (Short Opportunities): If the current bounce extends into the 160.00 – 160.212 (D1 POI) confluence zone, watch for price rejection and exhaustion signs to position for continuation shorts aligned with the macro breakdown.
- Continuation Scenario (Downside): Failure to sustain momentum above 158.00, or a confirmed rejection at the D1 POI, targets an initial move back down to 155.00, followed by a re-test of the 153.50 – 154.00 Q3 low.
Crude Oil Outlook
Fundamental Analysis
Heading into Q4, the outlook for crude oil remains heavily influenced by geopolitical developments, physical supply disruptions and the direction of global inventories. The ongoing US–Iran conflict and disruptions around the Strait of Hormuz remain major sources of uncertainty, while attacks on regional energy infrastructure have further reduced the availability of crude supplies. With global inventories falling rapidly, the latest EIA outlook expects Brent crude to average around $105 per barrel in Q4, reflecting continued tightness in the physical oil market.
The diesel market is another important factor supporting crude oil demand. Exceptionally tight diesel supplies are encouraging refiners to maximize diesel production, which increases demand for crude feedstock. At the same time, disruptions to refinery operations and fuel production in regions such as Russia could keep refined-product markets tight, providing additional support for oil prices even if crude supply gradually improves.
However, the outlook is not without downside risks. The IEA expects weaker global oil demand in 2026, raising concerns about demand destruction if elevated energy prices persist. Meanwhile, producers and exporters have been adapting to the disruption by using alternative export routes and other methods to maintain oil flows. A continued recovery in these alternative routes could gradually reduce supply pressures and weaken the geopolitical premium in oil prices.
Inventories will therefore remain a key indicator for Q4. Further declines in global inventories would reinforce the case for elevated oil prices, while a sustained recovery in oil flows and eventual inventory rebuilding could increase downside pressure. The balance between persistent supply disruptions and improving supply flexibility will be particularly important in determining the direction of the market.
Overall, crude oil enters Q4 with strong near-term fundamental support from geopolitical disruptions, falling inventories and tight diesel markets, while weaker demand and the gradual recovery of alternative supply routes create downside risks. The key question for Q4 will be whether physical supply constraints remain severe enough to outweigh improving supply flows and weaker demand.
Technical Analysis
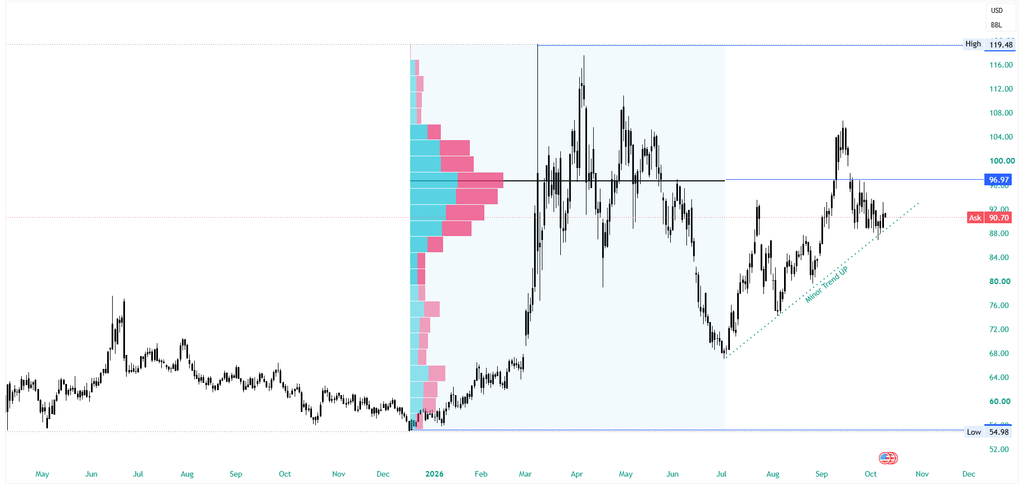
USOIL staged a powerful recovery throughout Q3 2026, transitioning from a sharp mid-year capitulation into an aggressive ascending impulse. After bottoming out at $68.00 in early July, crude embarked on a multi-month rally guided by a rising ascending support line (“Minor Trend UP”), topping out near $106.00 in early September before pulling back to consolidate at the current $90.70 level.
Q3 Price Action Recap (July – September 2026)
- July Reversal & Bottoming ($68.00): After a sustained multi-month decline from the $119.48 cycle peak, price action exhausted at the $68.00 baseline in early July, establishing the primary macro swing low of Q3.
- August Momentum Surge: Aggressive buying volume propelled oil above multiple resistance layers, establishing the Minor Trend UP ascending trendline and reclaiming the psychological $80.00 – $90.00 handle.
- September Peak ($106.00) & Compression Retracement: The rally peaked around the $105.50 – $106.00 liquidity pocket in early September, falling short of the macro $119.48 high. Heavy profit-taking pushed price into a multi-week retracement, bringing it directly back to test the ascending trendline support and the $90.70 asking price.
Key Technical Zones
- Current Price (Ask): $90.70 — Compressing directly along the ascending dynamic trendline support.
- Immediate Resistance / Macro POC: $96.97 — The horizontal Point of Control (POC) from the previous high-volume distribution block. Reclaiming this level is required to reopen macro upside momentum.
- Q3 Local High / Swing Resistance: $106.00 — The September rejection high and immediate swing-trade liquidity target.
- Macro High: $119.48 — The cycle peak and long-term supply barrier.
- Dynamic Support: Minor Trend UP (~$88.00 – $90.00) — The ascending trendline originating from the July low. As long as price respects this diagonal, the intermediate bullish market structure remains intact.
- Q3 Base Support Floor: $68.00 — The structural swing low of July that marked the beginning of the Q3 impulse.
Trading Strategy & Outlook
- Intermediate Bullish / Trendline Defense Bias: While short-term momentum from the September peak is corrective, the overarching structure since July remains constructive as long as the “Minor Trend UP” trendline holds.
- Trendline Bounce Scenario (Long Continuation): If buyers defend the $88.00 – $90.70 trendline cluster and print a bullish reversal structure, look for an initial re-test of the $96.97 POC, with an extended target toward the $106.00 September swing high.
- Breakdown Scenario (Trend Invalidation): A clean daily close below $88.00 will invalidate the ascending trendline, shifting short-term control back to sellers and triggering a deeper liquidation down toward $82.00, and potentially the $72.00 – $68.00 macro demand base
Conclusion
Q4 2026 begins with markets facing a delicate balance between resilient economic growth, persistent inflation and ongoing geopolitical risks. The US economy remains relatively strong, but signs of slower labor-market momentum could become increasingly important if they continue into the final quarter. At the same time, inflation remains above the Fed’s target, leaving monetary policy relatively restrictive and keeping Treasury Yields and the US dollar sensitive to incoming economic data.
Across major asset classes, the outlook will therefore depend heavily on how these competing forces develop. Gold could benefit from moderating inflation, lower Treasury Yields and reduced expectations for further Fed tightening, while persistent energy-driven inflation could continue to limit its upside. USD/JPY remains supported by the wide US–Japan interest-rate differential, but intervention risks and the possibility of weaker US economic data create meaningful downside risks. Crude oil, meanwhile, enters Q4 with stronger near-term support from geopolitical disruptions, falling inventories and tight diesel markets, although improving supply routes and weaker demand could eventually ease these pressures.
Overall, the key theme for Q4 will be whether inflationary and geopolitical pressures begin to ease without a significant deterioration in global economic growth. A more favorable combination of lower energy prices, moderating inflation and less restrictive monetary policy could create a more supportive environment across financial markets. Conversely, persistent inflation, elevated energy prices and continued supply disruptions could keep central banks cautious, Treasury Yields elevated and market volatility high.
As a result, Q4 is likely to remain highly sensitive to economic data, central-bank communication and geopolitical developments, making the interaction between these factors particularly important for the direction of major currencies, commodities and other asset classes.