
របាយការណ៍នេះនឹងផ្តល់នូវការវិភាគអំពីកត្តាចម្បងដែលជះឥទ្ធិពលលើតម្លៃមាស ទៅកាន់វិនិយោគិន។
ការបដិសេធ (Disclaimer): ព័ត៌មានទាំងអស់ដែលបង្ហាញគឺសម្រាប់ក្នុងគោលបំណងអប់រំតែប៉ុណ្ណោះ ហើយមិនគួរត្រូវប្រើប្រាស់ជាដំបូន្មានហិរញ្ញវត្ថុ ឬការណែនាំសម្រាប់ការសម្រេចចិត្តលើការជួញដូរ ឬការវិនិយោគនោះទេ។
ការវិភាគបែបសេដ្ឋកិច្ច (Fundamental Analysis)
ការសង្ខេបស្ថានភាពសេដ្ឋកិច្ចប្រចាំខែកក្កដា៖ ខែកក្កដា ឆ្នាំ2026 គឺជាខែដែលទីផ្សារហិរញ្ញវត្ថុសកលបន្តមានភាពប្រែប្រួលខ្លាំង ខណៈវិនិយោគិនបានតាមដានយ៉ាងជិតស្និទ្ធនូវការប្រែប្រួលនៃការរំពឹងទុកចំពោះគោលនយោបាយរូបិយវត្ថុរបស់ធនាគារកណ្ដាលអាមេរិក (Fed) ស្របពេលដែលភាពតានតឹងភូមិសាស្ត្រនយោបាយនៅមជ្ឈិមបូព៌ានៅតែបន្ត។ ទោះបីជាជម្លោះរវាងសហរដ្ឋអាមេរិក និងអ៊ីរ៉ង់នៅតែជាប្រភពសំខាន់នៃភាពប្រែប្រួលក្នុងទីផ្សារក៏ដោយ កត្តាដែលវិនិយោគិនផ្តោតសំខាន់ជាងគេ គឺថាតើការវិវឌ្ឍនៃជម្លោះនេះនឹងជំរុញឱ្យអតិផរណាកើនឡើងដែរឬទេ និងតើវានឹងប៉ះពាល់ដល់ទិសដៅគោលនយោបាយរបស់ Fed យ៉ាងដូចម្តេច។
ពេញមួយខែ ទិន្នន័យសេដ្ឋកិច្ចរបស់សហរដ្ឋអាមេរិកបានបង្ហាញពីសញ្ញាចម្រុះ ប៉ុន្តែសេដ្ឋកិច្ចជារួមនៅតែបង្ហាញភាពរឹងមាំ។ ទិន្នន័យ សន្ទស្សន៍ថ្លៃទំនិញប្រើប្រាស់ (CPI) និង សន្ទស្សន៍ថ្លៃចំណាយលើការប្រើប្រាស់ផ្ទាល់ខ្លួនស្នូល (Core PCE) ដែលចេញមកទាបជាងការរំពឹងទុក បានបង្ហាញថាសម្ពាធអតិផរណាកំពុងថយចុះជាបណ្តើរៗ ដែលដំបូងឡើយបានជំរុញឱ្យទីផ្សាររំពឹងថា Fed អាចនឹងបន្ធូរបន្ថយគោលនយោបាយរូបិយវត្ថុនាពេលខាងមុខ។ ទោះជាយ៉ាងណា សកម្មភាពអាជីវកម្មដែលនៅតែរឹងមាំ និងស្ថានភាពសេដ្ឋកិច្ចអាមេរិកដែលបន្តមានភាពធន់ បានពង្រឹងជំហរប្រុងប្រយ័ត្នរបស់ Fed ដូចដែលបានឆ្លុះបញ្ចាំងតាមរយៈការសម្រេចរក្សាអត្រាការប្រាក់មិនផ្លាស់ប្តូរក្នុងកិច្ចប្រជុំ FOMC ប្រចាំខែកក្កដា។ ជាមួយគ្នានេះដែរ កំណត់ហេតុនៃកិច្ចប្រជុំ FOMC ប្រចាំខែមិថុនា និងសក្ខីកម្មរបស់ប្រធាន Fed លោក Kevin Warsh នៅសភា ក៏បានបញ្ជាក់ថា ការសម្រេចចិត្តលើគោលនយោបាយនាពេលខាងមុខនឹងបន្តផ្អែកលើទិន្នន័យសេដ្ឋកិច្ចដែលចេញផ្សាយ។
ទន្ទឹមនឹងនេះ ការវិវឌ្ឍនៃស្ថានការណ៍ភូមិសាស្ត្រនយោបាយបានប្រែប្រួលរវាងការកើនឡើងនៃសកម្មភាពយោធា និងកិច្ចខិតខំប្រឹងប្រែងផ្នែកការទូត។ ការប៉ះទង្គិចរវាងសហរដ្ឋអាមេរិក និងអ៊ីរ៉ង់ ការវាយប្រហារលើនាវាពាណិជ្ជកម្ម និងការព្រួយបារម្ភជុំវិញ ច្រកសមុទ្រ Hormuz និង សមុទ្រក្រហម (Red Sea) បានជំរុញឱ្យតម្លៃប្រេងឡើងថ្លៃជាបន្តបន្ទាប់ ដែលបង្កើនការព្រួយបារម្ភថា អតិផរណាដែលជំរុញដោយថាមពលអាចពន្យារពេលការកាត់បន្ថយអត្រាការប្រាក់នាពេលអនាគត។ ផ្ទុយទៅវិញ ការរីកចម្រើនមួយចំនួនផ្នែកការទូតក៏បានជួយបន្ធូរបន្ថយការព្រួយបារម្ភអំពីការរីករាលដាលនៃជម្លោះក្នុងតំបន់ ដែលធ្វើឱ្យអារម្មណ៍វិនិយោគិនប្រែប្រួលជាញឹកញាប់។
ក្រោមបរិបទនេះ តម្លៃមាសបានជួបប្រទះភាពប្រែប្រួលខ្លាំងទាំងទិសឡើង និងទិសចុះក្នុងអំឡុងខែកក្កដា។ ដំបូងឡើយ មាសបានធ្លាក់ចុះក្រោមកម្រិត $4,000 ជាលើកដំបូងចាប់តាំងពីខែវិច្ឆិកា ឆ្នាំ២០២៥ ខណៈទីផ្សារបានរំពឹងថា Fed នឹងបន្តរក្សាអត្រាការប្រាក់នៅកម្រិតខ្ពស់ក្នុងរយៈពេលយូរ និងប្រាក់ដុល្លារអាមេរិកកាន់តែរឹងមាំ។ បន្ទាប់មក មាសបានងើបឡើងវិញ ដោយសារទិន្នន័យអតិផរណាទាបជាងការរំពឹងទុក ការកើនឡើងជាបណ្តោះអាសន្ននៃតម្រូវការលើទ្រព្យសកម្មសុវត្ថិភាព (Safe-Haven Demand) និងការបន្ធូរបន្ថយក្តីបារម្ភអំពីតម្លៃថាមពល ដែលបានជួយឱ្យមាសបិទខែជាមួយនឹងការកើនឡើង ទោះបីជាភាពមិនច្បាស់លាស់នៅតែបន្តក៏ដោយ។
ក្រៅពីសហរដ្ឋអាមេរិក ការចាប់អារម្មណ៍របស់ទីផ្សារក៏បានងាកទៅប្រទេសជប៉ុនផងដែរ ខណៈវិនិយោគិនកាន់តែរំពឹងថា ធនាគារកណ្ដាលជប៉ុន (BoJ) អាចនឹងបន្តរឹតបន្តឹងគោលនយោបាយរូបិយវត្ថុនៅប៉ុន្មានខែខាងមុខ។ ជារួម ខែកក្កដាបានបញ្ជាក់ម្តងទៀតថា ទោះបីជាព្រឹត្តិការណ៍ភូមិសាស្ត្រនយោបាយនៅតែជំរុញភាពប្រែប្រួលរយៈពេលខ្លីក្នុងទីផ្សារក៏ដោយ ការរំពឹងទុកអំពីអតិផរណា និងគោលនយោបាយរបស់ធនាគារកណ្ដាល នៅតែជាកត្តាចម្បងដែលកំណត់ទិសដៅទីផ្សារហិរញ្ញវត្ថុ។
តើធនាគារកណ្ដាលអាមេរិក (Fed) នឹងកាត់បន្ថយអត្រាការប្រាក់នៅឆ្នាំនេះដែរឬទេ?
បន្ទាប់ពីកិច្ចប្រជុំ FOMC ក្នុងខែកក្កដា ធនាគារកណ្ដាលអាមេរិក (Fed) បានសម្រេចរក្សាអត្រាការប្រាក់នៅដដែល ខណៈបន្តប្រកាន់ជំហរប្រុងប្រយ័ត្ន និងផ្អែកលើទិន្នន័យក្នុងការកំណត់គោលនយោបាយរូបិយវត្ថុ។ ទោះបីជាទិន្នន័យអតិផរណាថ្មីៗ រួមមាន CPI និង Core PCE ចេញមកទាបជាងការរំពឹងទុកក៏ដោយ ក៏អ្នកកំណត់គោលនយោបាយនៅតែបញ្ជាក់ថា ពួកគេត្រូវការភស្តុតាងបន្ថែមទៀត មុននឹងពិចារណាបន្ធូរបន្ថយគោលនយោបាយរូបិយវត្ថុ។
ជាមួយគ្នានេះ ទីផ្សារការងាររបស់សហរដ្ឋអាមេរិកក៏នៅតែបង្ហាញភាពរឹងមាំ។ កំណើនការងារនៅតែបន្ត ទោះបីជាមានសញ្ញាបង្ហាញពីការថមថយបន្តិចម្តងៗក៏ដោយ ខណៈកំណើនប្រាក់ឈ្នួល និងអត្រាគ្មានការងារធ្វើនៅតែស្ថិតក្នុងកម្រិតដែលឆ្លុះបញ្ចាំងពីទីផ្សារការងារដែលមានស្ថិរភាព។ ដរាបណាស្ថានភាពការងារនៅតែមានភាពរឹងមាំ Fed នឹងមានភាពបត់បែនកាន់តែច្រើនក្នុងការរក្សាអត្រាការប្រាក់នៅកម្រិតខ្ពស់ ខណៈបន្តតាមដានការវិវឌ្ឍនៃអតិផរណា។
អាស្រ័យហេតុនេះ អតិផរណាទំនងជានឹងបន្តជាកត្តាសំខាន់បំផុតដែលកំណត់ទិសដៅគោលនយោបាយរូបិយវត្ថុនៅប៉ុន្មានខែខាងមុខ។ ទោះបីជាទិន្នន័យថ្មីៗបង្ហាញថាសម្ពាធអតិផរណាកំពុងថយចុះក៏ដោយ ភាពតានតឹងភូមិសាស្ត្រនយោបាយនៅមជ្ឈិមបូព៌ានៅតែបង្កហានិភ័យដែលអាចជំរុញឱ្យតម្លៃថាមពល និងអតិផរណាកើនឡើងវិញ។ ប្រសិនបើតម្លៃប្រេងកើនឡើងខ្លាំងម្តងទៀត វាអាចធ្វើឱ្យកិច្ចខិតខំប្រឹងប្រែងរបស់ Fed ក្នុងការនាំអតិផរណាត្រឡប់ទៅគោលដៅ 2% កាន់តែពិបាក។
កត្តាមួយទៀតដែលបង្កើនភាពមិនច្បាស់លាស់ គឺការសម្រេចចិត្តរបស់ប្រធាន Fed លោក Kevin Warsh ក្នុងការផ្តោតសំខាន់លើទិន្នន័យសេដ្ឋកិច្ចដែលចេញផ្សាយ ខណៈកាត់បន្ថយការផ្តល់សញ្ញាជាមុន (Forward Guidance) បើប្រៀបធៀបនឹងថ្នាក់ដឹកនាំមុនៗ។ ជាលទ្ធផល ទិន្នន័យសេដ្ឋកិច្ចសំខាន់ៗនីមួយៗ រួមទាំងទិន្នន័យអតិផរណា និងទីផ្សារការងារ កាន់តែមានឥទ្ធិពលក្នុងការកំណត់ការរំពឹងទុករបស់ទីផ្សារ។
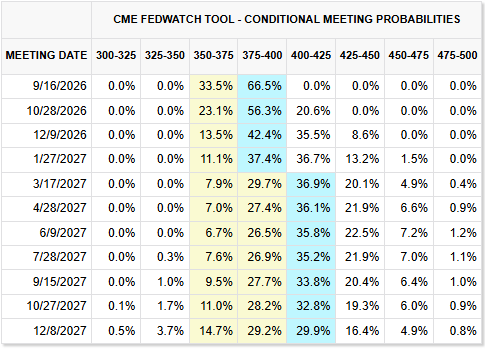
យោងតាមការរំពឹងទុកបច្ចុប្បន្នពី CME FedWatch ទីផ្សារនៅតែរំពឹងថា Fed នឹងដំឡើងអត្រាការប្រាក់នៅក្នុងកិច្ចប្រជុំ FOMC ខែកញ្ញា។ លុះត្រាតែអតិផរណាបន្តថយចុះយ៉ាងមានន័យក្នុងរយៈពេលប៉ុន្មានខែខាងមុខ លទ្ធភាពនៃការកាត់បន្ថយអត្រាការប្រាក់នៅឆ្នាំនេះនៅតែមានកម្រិតទាប។ សម្រាប់ទីផ្សារមាស ការរំពឹងថា Fed នឹងបន្តរក្សាអត្រាការប្រាក់នៅកម្រិតខ្ពស់ក្នុងរយៈពេលយូរ នៅតែជាកត្តាសំខាន់មួយដែលដាក់សម្ពាធលើតម្លៃមាស។
រដូវកាលប្រកាសលទ្ធផលហិរញ្ញវត្ថុត្រីមាសទី2៖ លទ្ធផលរឹងមាំ ប៉ុន្តែការរំពឹងទុកខ្ពស់បានបង្កើនភាពប្រែប្រួល
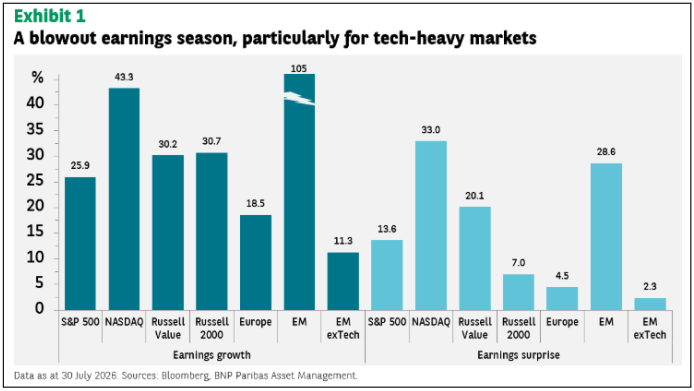
រដូវកាលប្រកាសលទ្ធផលហិរញ្ញវត្ថុត្រីមាសទី២ (Q2 Earnings Season) បានបង្ហាញពីលទ្ធផលដ៏រឹងមាំមួយទៀតសម្រាប់ទីផ្សារភាគហ៊ុនអាមេរិក ដោយក្រុមហ៊ុនក្នុងសន្ទស្សន៍ S&P 500 បានរាយការណ៍ពីកំណើនប្រាក់ចំណេញប្រមាណ 26% ធៀបនឹងរយៈពេលដូចគ្នាកាលពីឆ្នាំមុន។ ទន្ទឹមនឹងនេះ ក្រុមហ៊ុនបច្ចេកវិទ្យានៅតែជាកត្តាសំខាន់ដែលជំរុញកំណើនប្រាក់ចំណេញ ស្របពេលការវិនិយោគលើបច្ចេកវិទ្យាបញ្ញាសិប្បនិម្មិត (AI) បន្តកើនឡើង។ ក្រុមហ៊ុនជាច្រើនក៏បានប្រកាសលទ្ធផលលើសពីការរំពឹងទុករបស់អ្នកវិភាគ និងផ្តល់ទស្សនវិស័យវិជ្ជមានសម្រាប់ពេលខាងមុខ ដែលបានពង្រឹងទំនុកចិត្តរបស់វិនិយោគិនចំពោះកំណើនប្រាក់ចំណេញបន្តទៀត។
ទោះបីជាលទ្ធផលហិរញ្ញវត្ថុមានភាពរឹងមាំក៏ដោយ ភាគហ៊ុនក្នុងវិស័យបច្ចេកវិទ្យាបានបង្ហាញភាពប្រែប្រួលខ្លាំងក្នុងអំឡុងខែកក្កដា ដោយវិនិយោគិនបានចាប់ផ្តើមចោទសំណួរថា ការវិនិយោគដ៏ធំលើ AI នឹងអាចបង្កើតផលចំណេញបានលឿនគ្រប់គ្រាន់ដើម្បីគាំទ្រតម្លៃភាគហ៊ុនបច្ចុប្បន្នឬអត់។ ជាក់ស្តែង ក្រុមហ៊ុនមួយចំនួនដែលបានប្រកាសលទ្ធផលល្អជាងការរំពឹងទុក បែរជាតម្លៃភាគហ៊ុនធ្លាក់ចុះ ដែលបង្ហាញថាទីផ្សារកំពុងផ្តោតកាន់តែខ្លាំងលើទស្សនវិស័យអាជីវកម្ម និងសមត្ថភាពរកប្រាក់ចំណេញពីការវិនិយោគលើ AI ជាជាងលទ្ធផលហិរញ្ញវត្ថុតែមួយមុខ។
ក្នុងអំឡុងត្រីមាសនេះ ភាពខុសគ្នានៃលទ្ធផលរវាងក្រុមហ៊ុនបច្ចេកវិទ្យាបានកាន់តែច្បាស់។ ខណៈដែលសន្ទស្សន៍ S&P 500 និង Nasdaq 100 បន្តបង្ហាញកំណើនប្រាក់ចំណេញដ៏រឹងមាំ ការអនុវត្តរបស់ក្រុមហ៊ុនក្នុងវិស័យបច្ចេកវិទ្យាមិនមានទិសដៅដូចគ្នាទេ។ ក្រុមហ៊ុនបច្ចេកវិទ្យាធំៗដូចជា Microsoft, Apple និង Nvidia នៅតែបន្តបង្ហាញភាពរឹងមាំ ខណៈក្រុមហ៊ុនផលិតបន្ទះឈីប (Semiconductor) និងហេដ្ឋារចនាសម្ព័ន្ធ AI មួយចំនួនបានជួបការកែតម្រូវតម្លៃភាគហ៊ុនយ៉ាងខ្លាំង ទោះបីជាបានប្រកាសលទ្ធផលហិរញ្ញវត្ថុល្អក៏ដោយ។
ទោះបីជាសន្ទស្សន៍ភាគហ៊ុនសំខាន់ៗរបស់សហរដ្ឋអាមេរិករងសម្ពាធក្នុងអំឡុងខែកក្កដាក៏ដោយ ក៏ទីផ្សារបានចាប់ផ្តើមងើបឡើងវិញនៅដើមខែសីហា ដោយសារវិនិយោគិននៅតែមានទំនុកចិត្តលើលទ្ធផលអាជីវកម្ម និងសក្ដានុពលកំណើនរយៈពេលវែងរបស់ AI។ ទោះជាយ៉ាងណា ទីផ្សារទំនងជានឹងនៅតែមានភាពប្រែប្រួលខ្ពស់ចំពោះរបាយការណ៍លទ្ធផលហិរញ្ញវត្ថុនាពេលខាងមុខ ជាពិសេសប្រសិនបើក្រុមហ៊ុនមិនអាចបង្ហាញថាការវិនិយោគដ៏ធំលើ AI អាចបម្លែងទៅជាកំណើនប្រាក់ចំណូល និងប្រាក់ចំណេញប្រកបដោយនិរន្តរភាពបាន។
សម្រាប់អ្នកជួញដូរមាស រដូវកាលប្រកាសលទ្ធផលហិរញ្ញវត្ថុ គឺជាសូចនាករសំខាន់មួយសម្រាប់វាយតម្លៃអារម្មណ៍ទីផ្សាររួម។ ជាទូទៅ លទ្ធផលហិរញ្ញវត្ថុរឹងមាំអាចជំរុញការទទួលយកហានិភ័យរបស់វិនិយោគិន និងកាត់បន្ថយតម្រូវការលើទ្រព្យសកម្មសុវត្ថិភាព (Safe-haven Assets) ដូចជាមាស។ ផ្ទុយទៅវិញ ប្រសិនបើទីផ្សារភាគហ៊ុនមានភាពប្រែប្រួលខ្លាំង វាអាចជំរុញឱ្យវិនិយោគិនផ្លាស់ប្តូរទៅកាន់ទ្រព្យសកម្មដែលមានសុវត្ថិភាពជាង ដោយផ្តល់ការគាំទ្រដល់តម្លៃមាសក្នុងរយៈពេលខ្លី។
តើជម្លោះរវាងសហរដ្ឋអាមេរិក និងអ៊ីរ៉ង់នឹងរីករាលដាលពាសពេញតំបន់ដែរឬទេ?
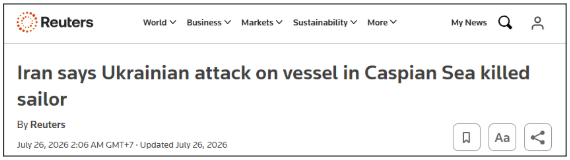
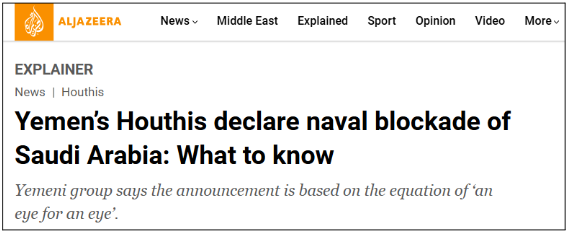
ទោះបីជាការប្រយុទ្ធដោយផ្ទាល់រវាងសហរដ្ឋអាមេរិក និងអ៊ីរ៉ង់បានថមថយក្នុងរយៈពេលថ្មីៗនេះក៏ដោយ ជម្លោះនេះនៅតែបន្តរីករាលដាលទៅកាន់តំបន់ផ្សេងៗ។ ការវាយប្រហារដែលពាក់ព័ន្ធនឹងចលនា Houthi របស់ប្រទេសយេម៉ែន និងការបិទផ្លូវជើងទឹករបស់ពួកគេលើនាវាអារ៉ាប៊ីសាអូឌីតនៅច្រកសមុទ្រក្រហម (Red Sea) រួមជាមួយការវាយប្រហាររបស់អ៊ុយក្រែននៅសមុទ្រ Caspian Sea លើនាវាដែលត្រូវបានចោទប្រកាន់ថាកំពុងដឹកជញ្ជូនសម្ភារៈយោធារបស់អ៊ីរ៉ង់ទៅកាន់ប្រទេសរុស្ស៊ី បានបង្ហាញថា ជម្លោះនេះកំពុងមានការតភ្ជាប់កាន់តែខ្លាំងជាមួយវិបត្តិក្នុងតំបន់ផ្សេងៗ។
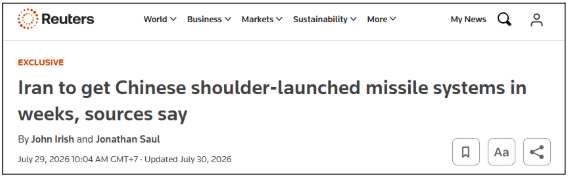
បន្ថែមពីលើនេះ របាយការណ៍ថ្មីៗបានបង្ហាញថា អ៊ីរ៉ង់អាចនឹងទទួលបានប្រព័ន្ធមីស៊ីលបាញ់ពីស្មាផលិតដោយប្រទេសចិនក្នុងពេលឆាប់ៗនេះ ដែលបានបង្កឱ្យមានការរំពឹងទុកថា មហាអំណាចក្នុងតំបន់ផ្សេងទៀតអាចនឹងចូលរួមកាន់តែសកម្មនៅក្នុងជម្លោះនេះ។ ទោះបីជាវានៅមិនទាន់ច្បាស់ថា ជម្លោះនឹងរីករាលដាលបន្ថែមទៀតឬយ៉ាងណាក៏ដោយ វិនិយោគិននៅតែបន្តតាមដានការវិវឌ្ឍទាំងនេះយ៉ាងជិតស្និទ្ធ ដើម្បីវាយតម្លៃថាតើអស្ថិរភាពក្នុងតំបន់នឹងកើនឡើងដែរឬទេ។
សម្រាប់ទីផ្សារហិរញ្ញវត្ថុ ក្តីបារម្ភចម្បងនៅតែផ្តោតលើការផ្គត់ផ្គង់ថាមពល។ ការរំខានដល់ផ្លូវដឹកជញ្ជូនសំខាន់ៗ ឬហេដ្ឋារចនាសម្ព័ន្ធប្រេង អាចជំរុញឱ្យតម្លៃប្រេងឆៅកើនឡើង ដែលនឹងបង្កើនសម្ពាធអតិផរណា និងអាចជំរុញឱ្យ Fed បន្តរក្សាគោលនយោបាយរូបិយវត្ថុតឹងរ៉ឹងក្នុងរយៈពេលយូរជាងមុន។ ផ្ទុយទៅវិញ ប្រសិនបើជម្លោះរីករាលដាលកាន់តែធ្ងន់ធ្ងរ វាក៏អាចជំរុញឱ្យមានតម្រូវការកាន់តែខ្ពស់លើទ្រព្យសកម្មសុវត្ថិភាព (Safe-Haven Asset) ដូចជាមាសផងដែរ។
ប្រសិនបើជម្លោះបន្តរីករាលដាល ទិសដៅរបស់មាសនឹងអាស្រ័យលើកត្តាណាមួយដែលមានឥទ្ធិពលខ្លាំងជាង៖ ការរំពឹងថា Fed នឹងបន្តរក្សាអត្រាការប្រាក់នៅកម្រិតខ្ពស់ដោយសារអតិផរណាកើនឡើង ឬការកើនឡើងនៃតម្រូវការលើទ្រព្យសកម្មសុវត្ថិភាព ដែលជំរុញដោយភាពមិនច្បាស់លាស់ផ្នែកភូមិសាស្ត្រនយោបាយ។
តើប្រទេសជប៉ុនអាចធ្វើឱ្យប្រាក់យ៉េនមានភាពរឹងមាំឡើងវិញបានដែរឬទេ?
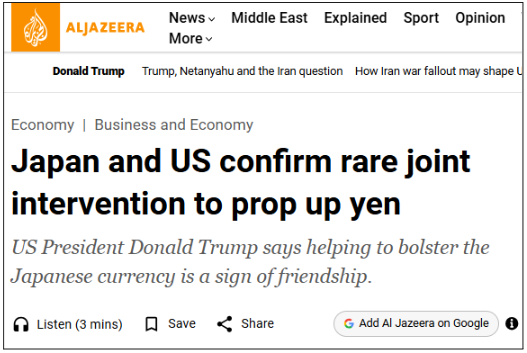
បន្ទាប់ពីប្រាក់យ៉េនបានធ្លាក់ថ្លៃជាបន្តបន្ទាប់អស់រយៈពេលជាច្រើនខែ ប្រទេសជប៉ុន និងសហរដ្ឋអាមេរិក ថ្មីៗនេះបានបញ្ជាក់ពីការធ្វើអន្តរាគមន៍រួមដ៏កម្រមួយនៅក្នុងទីផ្សារប្តូរប្រាក់បរទេស ដើម្បីគាំទ្រដល់ប្រាក់យ៉េន។ វិធានការនេះបានកើតឡើងបន្ទាប់ពីអត្រាប្តូរប្រាក់ USD/JPY បានកើនឡើងដល់ 163 ដែលជាកម្រិតខ្ពស់បំផុតក្នុងរយៈពេលប្រមាណ 40 ឆ្នាំ។ ការកើនឡើងនេះបានបង្កឱ្យមានការព្រួយបារម្ភអំពីអតិផរណាដែលបណ្តាលមកពីការនាំចូល និងស្ថិរភាពហិរញ្ញវត្ថុរបស់ប្រទេសជប៉ុន។
ទោះបីជាការធ្វើអន្តរាគមន៍រួមអាចជួយគាំទ្រដល់ប្រាក់យ៉េនក្នុងរយៈពេលខ្លីក៏ដោយ ប្រសិទ្ធភាពក្នុងរយៈពេលវែងរបស់វា ទំនងជានឹងអាស្រ័យលើគោលនយោបាយរូបិយវត្ថុ។ គម្លាតអត្រាការប្រាក់ដ៏ធំរវាងសហរដ្ឋអាមេរិក និងជប៉ុន នៅតែជាកត្តាដែលគាំទ្រដល់ប្រាក់ដុល្លារអាមេរិក។ ដូច្នេះ ការឱ្យប្រាក់យ៉េនងើបឡើងវិញប្រកបដោយនិរន្តរភាព អាចតម្រូវឱ្យ ធនាគារកណ្ដាលជប៉ុន (BoJ) បន្តធ្វើឱ្យគោលនយោបាយរូបិយវត្ថុមានលក្ខណៈតឹងរ៉ឹងជាងមុន ឬត្រូវការឱ្យ Fed បន្ទាបអត្រាការប្រាក់។
សម្រាប់ទីផ្សារមាស ប្រាក់យ៉េនដែលមានភាពរឹងមាំជាទូទៅ តែងតែស្របទៅនឹងការចុះខ្សោយនៃប្រាក់ដុល្លារអាមេរិក ដែលអាចផ្តល់ការគាំទ្រដល់ទំនិញដែលកំណត់តម្លៃជាប្រាក់ដុល្លារ ដូចជាមាស។ ដូច្នេះ វិនិយោគិនគួរតែបន្តតាមដានការវិវឌ្ឍនៃគោលនយោបាយរបស់ប្រទេសជប៉ុន ក៏ដូចជាការធ្វើអន្តរាគមន៍បន្ថែមណាមួយពីអាជ្ញាធរ ជាពិសេសប្រសិនបើអត្រាប្តូរប្រាក់ USD/JPY ខិតជិតដល់កម្រិតខ្ពស់ថ្មីម្តងទៀត។
ទស្សនវិស័យតម្លៃមាសសម្រាប់ខែសីហា៖ កត្តាសេដ្ឋកិច្ចសំខាន់ៗ
កត្តាគាំទ្រតម្លៃមាស៖ មាសអាចទទួលបានការគាំទ្របន្ថែមនៅក្នុងខែសីហា ប្រសិនបើទីផ្សារបន្តរំពឹងថា Fed នឹងអនុវត្តគោលនយោបាយរូបិយវត្ថុដែលមានភាពបន្ធូរបន្ថយជាងមុន។ ទិន្នន័យអតិផរណារបស់សហរដ្ឋអាមេរិកដែលចេញផ្សាយក្នុងខែកក្កដាដែលទាបជាងការរំពឹងទុក បានពង្រឹងការរំពឹងទុកថា សម្ពាធតម្លៃកំពុងថយចុះជាបណ្តើរៗ ដែលអាចបង្កើនលទ្ធភាពនៃការកាត់បន្ថយអត្រាការប្រាក់នាពេលអនាគត។ ការផ្លាស់ប្តូរទៅរកបរិយាកាសគោលនយោបាយរូបិយវត្ថុដែលមានភាពតឹងរ៉ឹងតិចជាងមុន នឹងកាត់បន្ថយតម្លៃឱកាស (Opportunity Cost) នៃការកាន់កាប់ទ្រព្យសកម្មដែលមិនផ្តល់ផលចំណេញជាអត្រាការប្រាក់ (Non-Yielding Asset) ដូចជាមាស ដែលអាចផ្តល់ការគាំទ្របន្ថែមដល់តម្លៃមាស។ ទន្ទឹមនឹងនេះ ការកើនឡើងនៃភាពតានតឹងភូមិសាស្ត្រនយោបាយជុំវិញសហរដ្ឋអាមេរិក និងអ៊ីរ៉ង់ នៅតែអាចជាកត្តាជំរុញតម្រូវការលើទ្រព្យសកម្មសុវត្ថិភាព (Safe-Haven Asset) ជាពិសេសប្រសិនបើវិនិយោគិនកាន់តែមានការព្រួយបារម្ភអំពីអស្ថិរភាពក្នុងតំបន់។ លើសពីនេះ ការចុះខ្សោយនៃប្រាក់ដុល្លារអាមេរិក ក៏អាចផ្តល់ការគាំទ្របន្ថែមដល់តម្លៃមាសផងដែរ ជាពិសេសប្រសិនបើការធ្វើអន្តរាគមន៍រួមរវាងប្រទេសជប៉ុន និងសហរដ្ឋអាមេរិក ដើម្បីគាំទ្រប្រាក់យ៉េន នាំឱ្យប្រាក់ដុល្លារអាមេរិកមានភាពទន់ខ្សោយជាងមុន។
កត្តាដែលដាក់សម្ពាធលើតម្លៃមាស៖ ទោះបីជាស្ថានភាពអតិផរណាមានភាពប្រសើរឡើងក៏ដោយ មាសនៅតែប្រឈមនឹងហានិភ័យធ្លាក់ចុះ ដោយសារអតិផរណានៅតែជាកត្តាសំខាន់ដែលកំណត់ទិសដៅគោលនយោបាយរបស់ Fed។ តម្លៃប្រេងដែលនៅតែខ្ពស់ដោយសារភាពតានតឹងនៅមជ្ឈិមបូព៌ា អាចបង្កើតសម្ពាធអតិផរណាឡើងវិញ ដែលអាចពន្យារពេលការបន្ធូរបន្ថយគោលនយោបាយរូបិយវត្ថុ និងពង្រឹងការរំពឹងទុកថា អត្រាការប្រាក់នឹងត្រូវរក្សានៅកម្រិតខ្ពស់ក្នុងរយៈពេលយូរ។ លើសពីនេះ ទិន្នន័យទីផ្សារការងារដែលរឹងមាំជាងការរំពឹងទុក អាចពង្រឹងជំហរប្រុងប្រយ័ត្នរបស់ Fed ដោយកាត់បន្ថយភាពចាំបាច់ក្នុងការកាត់បន្ថយអត្រាការប្រាក់ ដែលអាចគាំទ្រដល់ប្រាក់ដុល្លារអាមេរិក និងដាក់សម្ពាធលើតម្លៃមាស។ ទន្ទឹមនឹងនេះ ភាពមិនច្បាស់លាស់ជុំវិញជម្លោះរវាងសហរដ្ឋអាមេរិក និងអ៊ីរ៉ង់ នៅតែជាកត្តាដែលមានឥទ្ធិពលពីរផ្នែកសម្រាប់មាស ព្រោះភាពតានតឹងដែលអូសបន្លាយអាចជួយគាំទ្រតម្រូវការទ្រព្យសកម្មសុវត្ថិភាព (Safe-Haven Asset) ប៉ុន្តែក៏អាចរក្សាតម្លៃថាមពលឱ្យនៅខ្ពស់ និងបង្កើនហានិភ័យអតិផរណាផងដែរ។ ក្នុងបរិយាកាសទីផ្សារបច្ចុប្បន្ន ទិន្នន័យអតិផរណានឹងនៅតែជាកត្តាសំខាន់បំផុតដែលកំណត់ទិសដៅមាស ដោយសារវានឹងកំណត់ផ្លូវនៃគោលនយោបាយរបស់ Fed។ វិនិយោគិនក៏នឹងតាមដានយ៉ាងជិតស្និទ្ធនូវការវិវឌ្ឍនៅមជ្ឈិមបូព៌ា និងការធ្វើអន្តរាគមន៍ណាមួយពីធនាគារកណ្ដាលផងដែរ ព្រោះការផ្លាស់ប្តូរដែលមិនបានរំពឹងទុកនៅក្នុងកត្តាទាំងពីរនេះ អាចបង្កឱ្យមានភាពប្រែប្រួលបន្ថែមនៅក្នុងតម្លៃមាសពេញមួយខែសីហា។
ការវិភាគបច្ចេកទេស (Technical Analysis)
ការវិភាគបច្ចេកទេស៖ ទិដ្ឋភាពទូទៅនៃទីផ្សារមាស — ខែសីហា ឆ្នាំ 2026
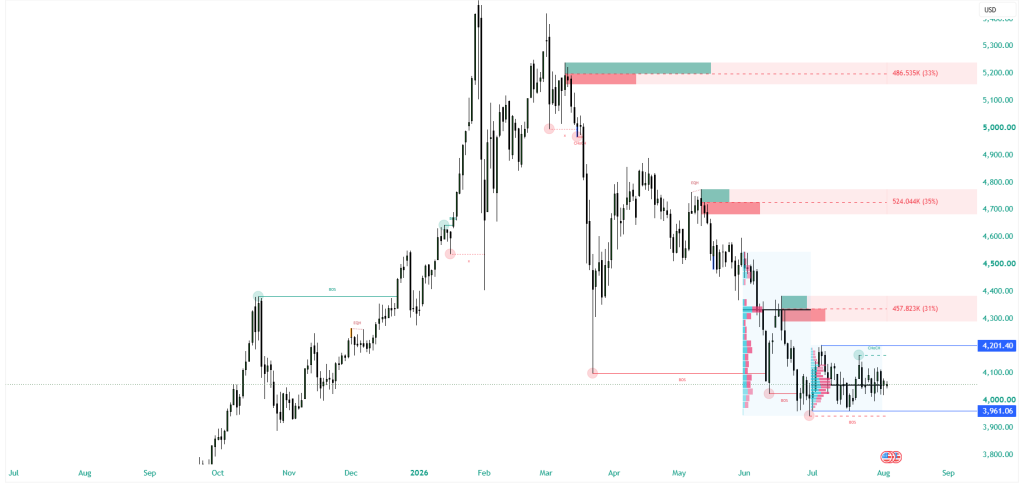
បច្ចុប្បន្ន មាសកំពុងស្ថិតក្នុងដំណាក់កាល Consolidation ក្នុងនិន្នាការធ្លាក់ចុះ (Downtrend) ជារួម។ ផ្អែកលើ Volume Profile ទីផ្សារកំពុងបង្ហាញពីការបង្រួមតម្លៃយ៉ាងតឹងណែន (Price Compression)។ ជួរតម្លៃដ៏ចង្អៀតនេះបង្ហាញថាទីផ្សារកំពុងប្រមូលផ្តុំសន្ទុះ ដែលជាទូទៅតែងតែកើតមានមុនពេលមាន Breakout យ៉ាងខ្លាំងក្លាក្នុងទិសដៅណាមួយ។
តំបន់បច្ចេកទេសសំខាន់ៗ
- Last Month Point of Control (POC) នៅតម្លៃ $4,057.32៖ ជាកម្រិត Volume ខ្ពស់បំផុតពីខែមុន ដែលដើរតួជាគោលចម្បងសម្រាប់សកម្មភាពតម្លៃបច្ចុប្បន្ន និងបង្ហាញពីកន្លែងដែលអ្នកចូលរួមក្នុងទីផ្សារធ្លាប់ទទួលបានតម្លៃខ្ពស់បំផុត។
- Upside Breakout Level នៅតម្លៃ $4,201.40៖ ជាកម្រិតរារាំង (Resistance) ខាងលើដ៏សំខាន់។ នេះជាព្រំដែនខាងលើនៃដំណាក់កាល Consolidation បច្ចុប្បន្ន។
- Downside Breakout Level នៅតម្លៃ $3,961.06៖ ជាកម្រិតទប់ (Support) ដ៏សំខាន់។ នេះជាព្រំដែនខាងក្រោមនៃដំណាក់កាល Consolidation និងដើរតួជាចំណុចចាប់ផ្តើម (Trigger line) សម្រាប់ការបន្តធ្លាក់ចុះ។
យុទ្ធសាស្ត្រជួញដូរ
- Consolidation / Bearish Bias: ទោះបីជានិន្នាការរួមនៅតែជាការធ្លាក់ចុះ (Bearish) ក៏ដោយ ក៏បច្ចុប្បន្នទីផ្សារកំពុងជាប់គាំងនៅក្នុងដំណាក់កាល Consolidation កណ្តាល។ Volume Profile បង្ហាញពីការប្រមូលផ្តុំថាមពល ដែលបង្កើនលទ្ធភាពនៃការផ្លាស់ទីយ៉ាងខ្លាំងក្លានាពេលខាងមុខ។ វិនិយោគិនគួរតែរក្សាការប្រុងប្រយ័ត្ន និងជៀសវាងការដាក់ទុនច្រើនហួសហេតុពេក ខណៈពេលដែលតម្លៃកំពុងរំកិលចុះឡើងជុំវិញ POC កណ្តាល។
- Breakout Scenario:
- Downside (ចុះក្រោម)៖ ប្រសិនបើតម្លៃអាចបំបែកយ៉ាងច្បាស់ និងបន្តជួញដូរនៅក្រោមទីតាំង Support $3,961.06 នោះសន្ទុះ Bearish ជារួមត្រូវបានរំពឹងថានឹងកើនឡើងយ៉ាងឆាប់រហ័ស។
- Upside (ឡើងលើ)៖ ផ្ទុយទៅវិញ ប្រសិនបើអ្នកទិញអាចរុញច្រាន និងរក្សាតម្លៃនៅពីលើកម្រិត Resistance $4,201.40 នោះវាអាចនឹងមោឃភាព Bearish Bias ភ្លាមៗ ហើយជំរុញឱ្យមានការងើបឡើងវិញ (Relief Rally) យ៉ាងខ្លាំង។
- Execution (ការអនុវត្ត)៖ វិធីសាស្ត្រដ៏ល្អបំផុតគឺត្រូវរង់ចាំការបញ្ជាក់ (Confirmed) នៃការកើតមាន Breakout ជាមួយនឹង Volume ខ្ពស់ចេញពីជួរតម្លៃដែលបានកំណត់នេះសិន មុននឹងសម្រេចចិត្តចូលជួញដូរថ្មី (New Entries)។
ការវិភាគបច្ចេកទេសទិដ្ឋភាពទូទៅនៃទីផ្សារ USD/JPY — ខែសីហា ឆ្នាំ 2026
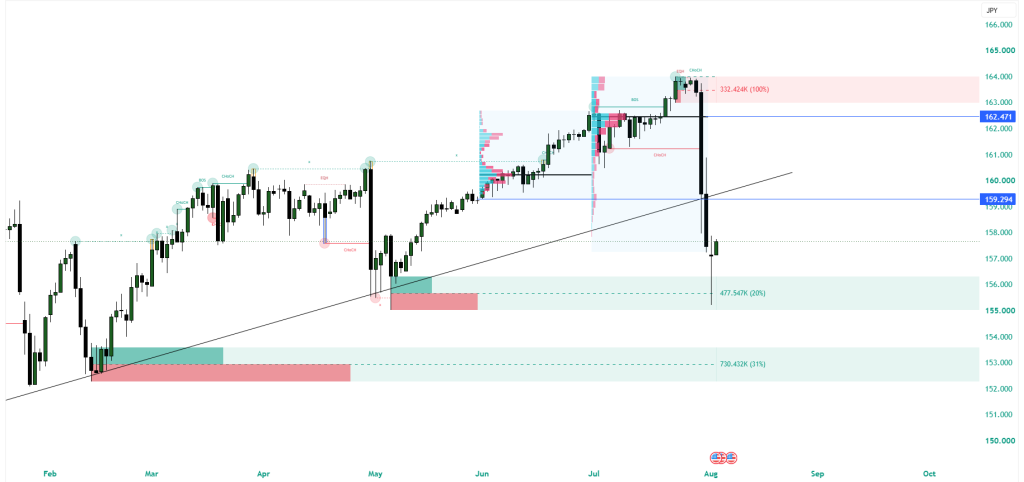
បច្ចុប្បន្ន USD/JPY កំពុងជួញដូរនៅតម្លៃ 157.642 ដោយបង្កើតបាននូវសន្ទុះធ្លាក់ចុះយ៉ាងខ្លាំងក្លា ។ រចនាសម្ព័ន្ធទីផ្សារបានផ្លាស់ប្តូរយ៉ាងខ្លាំងបន្ទាប់ពីតារាងតម្លៃប្រចាំខែកក្កដាបានបិទយ៉ាងច្បាស់លាស់នៅក្រោមតម្លៃទាបបំផុតនៃខែមិថុនាត្រង់ 159.294 ដែលបញ្ជាក់ពីសម្ពាធនៃការលក់យ៉ាងខ្លាំង និងការបន្តនៃនិន្នាការធ្លាក់ចុះ ។
តំបន់បច្ចេកទេសសំខាន់ៗ
- តម្លៃបច្ចុប្បន្ន៖ 157.642 — កំពុងជួញដូរយ៉ាងឆ្ងាយនៅក្រោមតំបន់តម្លៃ និងកម្រិតទប់ (support levels) សំខាន់ៗកាលពីខែមុន ដែលបង្ហាញថាអ្នកលក់បច្ចុប្បន្នកំពុងគ្រប់គ្រងទីផ្សារទាំងស្រុង ។
- កម្រិតទប់ពីមុនក្លាយជាកម្រិតរារាំងនៅ 159.294៖ ដែលជាតម្លៃទាបបំផុតនៃខែមិថុនា ។ ដោយសារតែខែកក្កដាបានបិទយ៉ាងខ្លាំងនៅក្រោមកម្រិតនេះ ឥឡូវនេះកម្រិតនេះដើរតួជាពិតាន (ceiling) ភ្លាមៗដំបូងគេសម្រាប់ការងើបឡើងវិញរយៈពេលខ្លីណាមួយ ។
- កម្រិតរារាំងសំខាន់នៅ 160.539៖ ជាកម្រិតរារាំងរចនាសម្ព័ន្ធដ៏សំខាន់ ។ ប្រសិនបើអ្នកទិញអាចរុញច្រានតម្លៃឱ្យខ្ពស់ជាងតម្លៃទាបបំផុតនៃខែមិថុនា នេះគឺជារបាំងដ៏សំខាន់បន្ទាប់ដែលអ្នកលក់ទំនងជានឹងឈានជើងចូលទីផ្សារវិញ ។
- Last Month Point of Control (POC) នៅតម្លៃ 162.471៖ ជាកម្រិតទំហំជួញដូរខ្ពស់បំផុតពីខែកក្កដា ដែលដើរតួជាកម្រិតរារាំងខាងលើដ៏ធំ ។ នេះបង្ហាញពីកន្លែងដែលអ្នកចូលរួមក្នុងទីផ្សារធ្លាប់ទទួលបានតម្លៃខ្ពស់បំផុតមុនពេលមានការលក់យ៉ាងគំហុក ។
យុទ្ធសាស្ត្រជួញដូរ
- Bearish Bias: និន្នាការរួមគឺធ្លាក់ចុះយ៉ាងខ្លាំង ដែលត្រូវបានបញ្ជាក់ដោយការបិទប្រចាំខែយ៉ាងខ្លាំងនៅក្រោមតម្លៃទាបបំផុតនៃខែមិថុនា ។ ការជួញដូរនៅក្រោម Point of Control នៃខែមុនបង្ហាញពីកង្វះចំណាប់អារម្មណ៍របស់អ្នកទិញនៅតម្លៃខ្ពស់ ។ ពាណិជ្ជករដែលស្វែងរកឱកាសទិញ (long) គួរតែមានការប្រុងប្រយ័ត្នខ្ពស់ ដោយសារប្រូបាប៊ីលីតេនៃការវិលត្រឡប់ឡើងវិញ (bullish reversal) ប្រកបដោយនិរន្តរភាពមានកម្រិតទាបបំផុតនៅដំណាក់កាលនេះ ។
- Continuation/Pullback Scenario: ផ្លូវដែលមានការរារាំងតិចបំផុតនៅតែស្ថិតក្នុងទិសដៅធ្លាក់ចុះ ។ ប្រសិនបើមានការទាញត្រឡប់ (pullback) រយៈពេលខ្លីកើតឡើង ទីផ្សារទំនងជានឹងសាកល្បងកម្រិត 159.294 (អតីតតម្លៃទាបបំផុតនៃខែមិថុនា) ឬកម្រិតរារាំងសំខាន់ 160.539 ម្តងទៀត ។ តំបន់ទាំងនេះអាចផ្តល់នូវឱកាសដែលមានប្រូបាប៊ីលីតេខ្ពស់សម្រាប់ការចូលលក់ (short entries) ។ ផ្ទុយទៅវិញ ដរាបណាតម្លៃនៅតែបន្តជួញដូរនៅក្រោម 159.294 សន្ទុះនៃការធ្លាក់ចុះត្រូវបានរំពឹងថានឹងកើនឡើងឆ្ពោះទៅរកគោលដៅគាំទ្រ (support targets) ដែលទាបជាងនេះ ។
| English Version |
This report provides an analysis of the primary factors influencing gold prices, offering insights for investors.
Disclaimer: All information presented is for educational purposes only and should not be interpreted as financial advice or a recommendation for trading or investment decisions.
Fundamental Analysis
Recap of July: July 2026 was another eventful month for global financial markets as investors navigated evolving expectations for U.S. monetary policy alongside persistent geopolitical tensions in the Middle East. While the conflict between the United States and Iran remained a major source of market volatility, investors increasingly focused on whether geopolitical developments would affect inflation and, in turn, the Federal Reserve’s policy outlook.
Throughout the month, U.S. economic data presented a mixed but generally resilient picture. Softer-than-expected Consumer Price Index (CPI) and Core Personal Consumption Expenditure (Core PCE) data suggested that inflationary pressures were gradually easing, initially boosting expectations for future policy easing. However, stronger business activity and continued resilience in the U.S. economy reinforced the Federal Reserve’s cautious stance, as shown by the Fed’s rate hold in July’s FOMC meeting. The release of the June FOMC meeting minutes and Fed Chair Kevin Warsh’s congressional testimony further emphasized that future policy decisions would remain dependent on incoming economic data.
Meanwhile, geopolitical developments continued to shift between military escalation and diplomatic negotiations. Exchanges of fire between the United States and Iran, attacks on commercial shipping, and concerns over the Strait of Hormuz and the Red Sea periodically pushed oil prices higher, raising fears that renewed energy-driven inflation could delay future interest rate cuts. However, intermittent diplomatic progress helped ease concerns of a broader regional conflict, resulting in frequent swings in investor sentiment.
Against this backdrop, gold experienced significant two-way volatility during July. The precious metal initially fell below the $4,000 level for the first time since November 2025 as markets priced in a higher-for-longer Federal Reserve and a stronger U.S. dollar. Gold later recovered as softer inflation data, intermittent safe-haven demand, and easing concerns over energy prices provided support, allowing the metal to finish the month higher despite ongoing uncertainty.
Outside the United States, attention also turned to Japan as markets increasingly anticipated that the Bank of Japan could tighten monetary policy further in the coming months. Overall, July reinforced that while geopolitical developments continued to drive short-term market volatility, expectations surrounding inflation and central bank policy remained the dominant force shaping financial markets.
Will the Federal Reserve Cut Interest Rates This Year?
Following July’s FOMC meeting, the Federal Reserve kept interest rates unchanged while maintaining a cautious, data-dependent approach to monetary policy. Although recent inflation data—including the Consumer Price Index (CPI) and the Fed’s preferred Core PCE Price Index—came in softer than expected, policymakers continue to emphasize that additional evidence is needed before considering any policy easing.
The U.S. labor market also remains relatively resilient. Employment growth has continued despite signs of gradual moderation, while wage growth and unemployment have remained broadly consistent with a healthy labor market. As long as employment conditions remain stable, the Federal Reserve has greater flexibility to keep interest rates elevated while monitoring inflation.
Inflation is therefore likely to remain the most important factor shaping monetary policy over the coming months. Although recent data suggests price pressures may be easing, ongoing geopolitical tensions in the Middle East continue to pose upside risks to energy prices and inflation. Any renewed surge in oil prices could complicate the Fed’s efforts to return inflation to its 2% target.
Adding further uncertainty is Fed Chair Kevin Warsh’s decision to place greater emphasis on incoming economic data while providing less forward guidance than previous leadership. As a result, each major economic release—including inflation and labor market data—has become increasingly important in shaping market expectations.
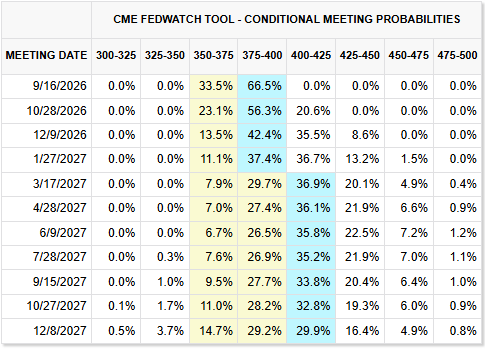
According to current CME FedWatch pricing, markets continue to anticipate an interest-rate increase at the September FOMC meeting. Unless inflation continues to soften meaningfully over the coming months, the case for a rate cut remains relatively weak. For gold, persistent higher-for-longer interest-rate expectations continue to represent one of the largest headwinds.
Q2 Earnings Season: Strong Results, but High Expectations Fuel Volatility
Q2 earnings season delivered another strong quarter for U.S. equities, with companies in the S&P 500 reporting earnings growth of approximately 26% year-on-year, while technology companies continued to lead overall profit growth as artificial intelligence (AI) investment remained a key driver. Many companies also exceeded analysts’ expectations and issued positive forward guidance, reinforcing confidence in the broader earnings outlook.
Despite these strong results, technology stocks experienced heightened volatility throughout July as investors questioned whether the industry’s substantial AI-related capital expenditure would generate returns quickly enough to justify current valuations. Several companies that beat earnings expectations still saw their share prices decline, highlighting that markets are becoming increasingly focused on future guidance and the profitability of AI investments rather than headline earnings alone.
Over the quarter, the divergence within the technology sector became increasingly evident. While the S&P 500 and Nasdaq 100 delivered another quarter of strong earnings growth, performance within the technology sector became increasingly uneven. Large-cap technology companies such as Microsoft, Apple, and Nvidia continued to outperform, whereas several semiconductor and AI infrastructure companies experienced significant corrections despite reporting solid financial results.
Although major U.S. equity indices came under pressure during July, they have begun recovering in early August as investors continue to view corporate earnings and the long-term AI growth story positively. Nevertheless, markets are likely to remain sensitive to future earnings releases, particularly if companies fail to demonstrate that their substantial AI investments can translate into sustainable revenue and profit growth.
For gold traders, earnings season provides valuable insight into overall market sentiment. Strong earnings generally improve risk appetite and can reduce demand for safe-haven assets such as gold. However, periods of heightened equity market volatility may encourage investors to rotate into defensive assets, providing temporary support for the precious metal.
Will the US-Iran Conflict Spread Across the Region?
Although direct fighting between the United States and Iran has recently slowed, the broader conflict continues to expand across the region. Attacks involving Yemen’s Houthi movement and their naval blockade on Saudi vessels in the Red Sea and Ukrainian strikes in the Caspian Sea on vessels allegedly transporting Iranian military supplies to Russia illustrate how the conflict is becoming increasingly interconnected with other regional disputes.
Adding to market concerns, recent reports suggest that Iran could soon receive Chinese-made shoulder-launched missile systems, raising speculation that additional regional powers may become more directly involved. While it remains unclear whether the conflict will widen further, investors are closely monitoring developments for signs that regional instability could escalate.
For financial markets, the primary concern remains energy supply. Any disruption to major shipping routes or oil infrastructure could push crude oil prices higher, increasing inflationary pressures and potentially encouraging the Federal Reserve to maintain restrictive monetary policy for longer. Conversely, a broader regional conflict could also increase safe-haven demand for assets such as gold.
Should the conflict continue to spread, gold’s direction will likely depend on which force proves stronger: higher interest-rate expectations resulting from inflation, or increased demand for safe-haven assets driven by geopolitical uncertainty.
Can Japan Reverse the Yen’s Weakness?
Following months of sustained depreciation, Japan and the United States recently confirmed a rare coordinated intervention in the foreign exchange market to support the Japanese yen. The move came after USD/JPY climbed to 163, a level not seen in approximately four decades, prompting concerns over imported inflation and financial stability within Japan.
While coordinated intervention can provide temporary support for the yen, its long-term effectiveness will likely depend on monetary policy. The wide interest-rate differential between the United States and Japan continues to favor the U.S. dollar, meaning sustained appreciation in the yen may ultimately require further policy normalization from the Bank of Japan or a shift toward lower interest rates in the United States.
For gold, a stronger yen generally corresponds with a weaker U.S. dollar, which can provide support for dollar-denominated commodities. Traders should therefore continue monitoring both Japanese policy developments and any further intervention by authorities, particularly if USD/JPY approaches recent highs once again.
Gold Outlook for August: Key Fundamental Drivers
Factors Supporting Gold Prices: Gold could find further support in August if markets continue to price in a more accommodative Federal Reserve policy outlook. Softer-than-expected U.S. inflation data released in July strengthened expectations that price pressures may be gradually easing, increasing the possibility of future rate cuts. A shift toward a less restrictive monetary policy environment would reduce the opportunity cost of holding non-yielding assets such as gold, potentially providing further support for prices. Meanwhile, escalating geopolitical tensions surrounding the United States and Iran remain a potential source of safe-haven demand, particularly if investors become increasingly concerned about broader regional instability. In addition, a weaker U.S. dollar could provide further support for gold prices, especially if coordinated efforts between Japan and the United States to stabilize the yen contribute to broader dollar weakness.
Factors Weighing on Gold Prices: Despite improving inflation trends, gold continues to face downside risks as inflation remains the key factor influencing the Federal Reserve’s policy outlook. Elevated oil prices caused by ongoing tensions in the Middle East could create renewed inflationary pressures, potentially delaying monetary easing and reinforcing expectations that interest rates will remain higher for longer. Furthermore, stronger-than-expected labor market data could strengthen the Fed’s cautious stance by reducing the urgency for rate cuts, supporting the U.S. dollar and weighing on gold prices. Meanwhile, the continued uncertainty surrounding the U.S.-Iran conflict remains a double-edged sword for gold, as prolonged tensions could provide safe-haven support but also maintain upward pressure on energy prices and inflation. In the current market environment, inflation data will likely remain the most important factor influencing gold’s direction, as it continues to determine the Federal Reserve’s policy path. Investors will also closely monitor developments in the Middle East and any potential central bank interventions, as unexpected changes in either area could create additional volatility in gold prices throughout August.
Technical Analysis
Technical Analysis: Gold Market Overview — August 2026
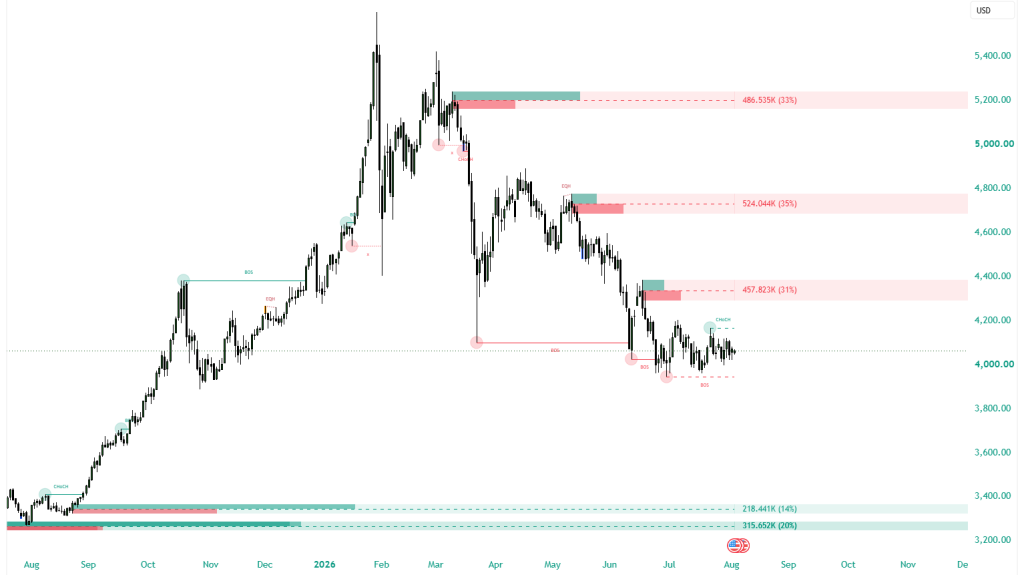
Gold is currently consolidating within a broader downtrend. Based on the volume profile, the market is exhibiting a period of tight price compression. This tightening range indicates that the market is building momentum, which typically precedes a strong directional breakout.
Key Technical Zones
- Last Month Point of Control (POC) at $4,057.32: The highest volume level from last month, acting as the primary anchor for current price action and indicating where market participants previously found the most value.
- Upside Breakout Level at $4,201.40: The critical overhead resistance. This marks the upper boundary of the current consolidation phase.
- Downside Breakout Level at $3,961.06: The vital support floor. This marks the lower boundary of the consolidation phase and serves as the trigger line for downside continuation.
Trading Strategy
- Consolidation / Bearish Bias: While the overarching trend remains bearish, the market is currently trapped in a neutral consolidation phase. The volume profile suggests a buildup of energy, increasing the likelihood of an impending, aggressive move. Traders should remain cautious and avoid overcommitting while the price chops around the central POC.
- Breakout Scenario:
- Downside: If the price cleanly breaks and sustains trading below the $3,961.06 support level, the broader bearish momentum is expected to accelerate rapidly.
- Upside: Conversely, if buyers can push and sustain the price above the $4,201.40 resistance, it could invalidate the immediate bearish bias and trigger a strong relief rally.
- Execution: The optimal approach is to wait for a confirmed, high-volume breakout from this established range before executing new entries.
Technical Analysis: USD/JPY Market Overview — August 2026
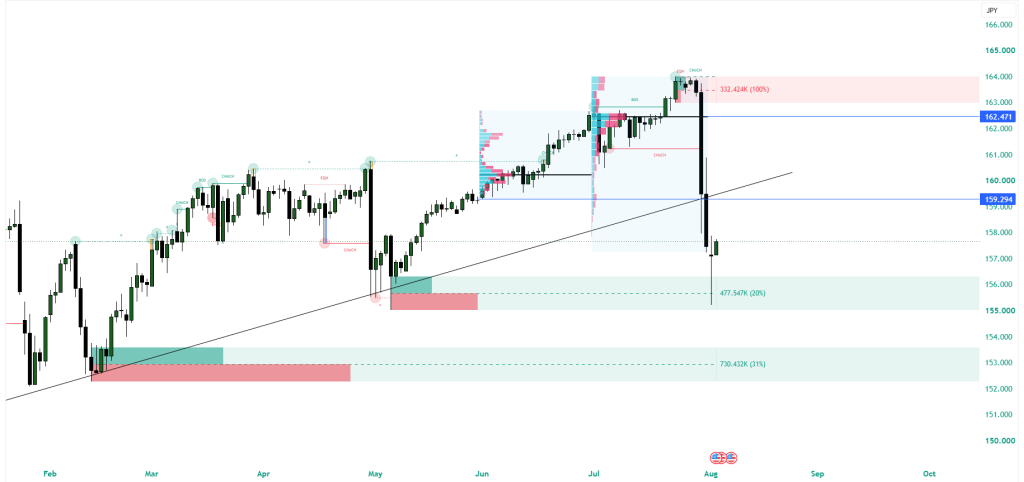
USD/JPY is currently trading at 157.642, establishing a strong bearish momentum. The market structure shifted significantly after the July monthly candlestick closed decisively below the June low of 159.294, confirming aggressive selling pressure and a continuation of the downtrend.
Key Technical Zones
- Current Price: 157.642 — Trading well below last month’s value areas and critical support levels, indicating that sellers are currently in full control of the market.
- Previous Support Turned Resistance at 159.294: The June low. Because July closed strongly below this mark, this level now acts as the first immediate ceiling for any short-term relief rallies.
- Key Resistance at 160.539: A major structural resistance level. If buyers manage to push the price above the June low, this is the next critical barrier where sellers are likely to step back in.
- Last Month Point of Control (POC) at 162.471: The highest volume level from July, acting as a massive overhead resistance. This indicates where market participants previously found the most value before the aggressive sell-off occurred.
Trading Strategy
- Bearish Bias: The overarching trend is heavily bearish, validated by the strong monthly close below June’s lows. Trading well below the previous month’s Point of Control suggests a lack of buyer interest at higher prices. Traders looking for long opportunities should remain highly cautious, as the probability of a sustained bullish reversal is very low at this stage.
- Continuation / Pullback Scenario: The path of least resistance remains to the downside. If a short-term pullback occurs, the market is likely to retest the 159.294 (former June low) or the 160.539 key resistance level. These zones may provide high-probability opportunities for short entries. Conversely, as long as the price sustains trading below 159.294, bearish momentum is expected to accelerate toward lower support targets.