Understanding Bearish Harami Candlestick Patterns
តើអ្វីទៅជា Bearish Harami Candlestick Pattern?
និយមន័យ
Bearish Harami Patternបង្ហាញពីភាពមិនប្រាកដរបស់អ្នកចូលរួមក្នុងទីផ្សារ។ វាក៏បង្ហាញថាសម្ពាធអ្នកទិញកំពុងធ្លាក់ចុះ ហើយអ្នកលក់កំពុងចូលមកគ្រប់គ្រងក្នុងទីផ្សារ។
រូបរាង
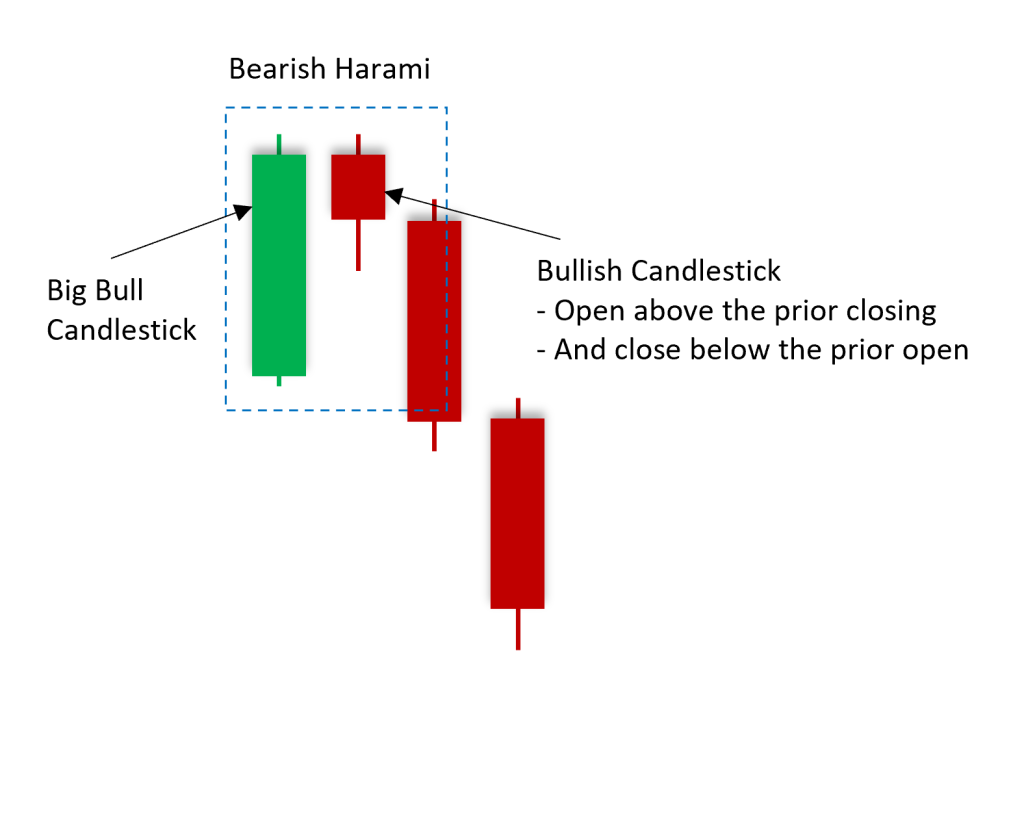
លក្ខណៈសម្គាល់
ទម្រង់ទាន Bearish Harami ផ្ទុកទៅដោយទាន២។ វាត្រូវបានសម្គាល់ដោយទានក្រហមដែលមានតួរខ្លួនតូចមួយកើតឡើងនៅក្នុងចន្លោះនៃតួខ្លួនរបស់ទានឡើងធំមួយ។ ទម្រង់នេះតែងតែកើតឡើងនៅខាងចុងនៃលំហូរឡើង ដែលផ្តល់សញ្ញាប្រាប់យើងថាអាចនឹងមានការប្តូរទិសដៅរពីឡើងមកចុះវិញ។
ឩទាហរណ៍
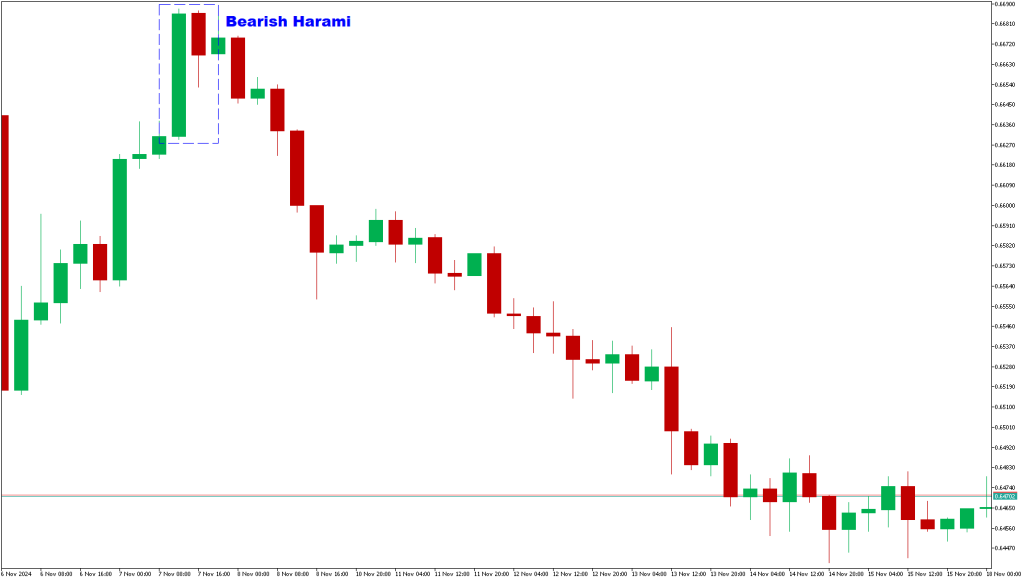
ទម្រង់ទាន Bearish Harami គឺជាសូចនាករចង្អុលបង្ហាញពីកម្លាំងអ្នកលក់ខ្លាំង ដែលបង្ហាញថាទីផ្សារអាចនឹងខិតជិតដល់ចំណុចកំពូល ឬកម្រិតខ្ពស់គួរឱ្យកត់សម្គាល់។ទានមានការកើនឡើងធំឆ្លុះបញ្ចាំងពីសម្ពាធទិញដ៏ខ្លាំង ខណៈពេលដែលទានធ្លាក់ចុះតូចជាងដែលនៅខាងក្រោមបង្ហាញថាអ្នកលក់កំពុងទទួលបានការគ្រប់គ្រង និងជំរុញឱ្យតម្លៃធ្លាក់ចុះ។ គំរូនេះច្រើនតែត្រូវបានប្រៀបធៀបទៅនឹងលំនាំការធ្លាក់ចុះនៃការធ្លាក់ចុះ ដោយសារតែទាំងពីរនេះបង្ហាញពីលទ្ធភាពនៃទីផ្សារជិតដល់កំពូល ឬកម្រិតខ្ពស់គួរឱ្យកត់សម្គាល់។
តាមការសិក្សារមួយក្រោមប្រធានបទ “The Effectiveness of Candlestick Patterns in Financial Markets” ស្រាវជ្រាវដោយលោកសាស្រ្តាចារ្យ Wing-Keung Wong និងក្រុមស្រាវជ្រាវរបស់លោកដែលមកពីដេប៉ាតេម៉ងផ្នែកសេដ្ឋកិច្ចនៅសកលវិទ្យាល័យ Hong Kong Baptist University បានរកឃើញថាទម្រង់ទាន bearish harami មានអត្រាជោគជ័យរហូតដល់ ៦៣%ក្នុងការព្យាករណ៍ពីការផ្លាស់ប្តូរទិសដៅពីលំហូរឡើងមកជាលំហូរចុះវិញ។
English Version
What is Bearish Harami candlestick Pattern?
Definition
The Bearish Harami Pattern reflects uncertainty among market participants. It also signals a decline in buying pressure, with sellers gradually gaining control of the market.
Appearance
Characteristics
The Bearish Harami candlestick pattern consists of two candles. It is defined by a small red-bodied candle forming within the range of a preceding larger green-bodied candle. This pattern typically appears at the top of a chart, signaling a possible reversal from a bullish trend to a bearish one.
Example
The bearish harami pattern is a strong bearish indicator, signaling that the market may be approaching a peak or a significant high. The large bullish candlestick reflects strong buying pressure, while the smaller bearish candlestick that follows indicates that sellers are gaining control and pushing prices downward. This pattern is often compared to the bearish engulfing pattern, as both suggest the possibility of the market nearing a top or a notable high.
A study titled “The Effectiveness of Candlestick Patterns in Financial Markets”, led by Professor Wing-Keung Wong and his team from the Department of Economics at Hong Kong Baptist University, found that the bearish harami pattern has an approximate 63% success rate in predicting bearish reversals.