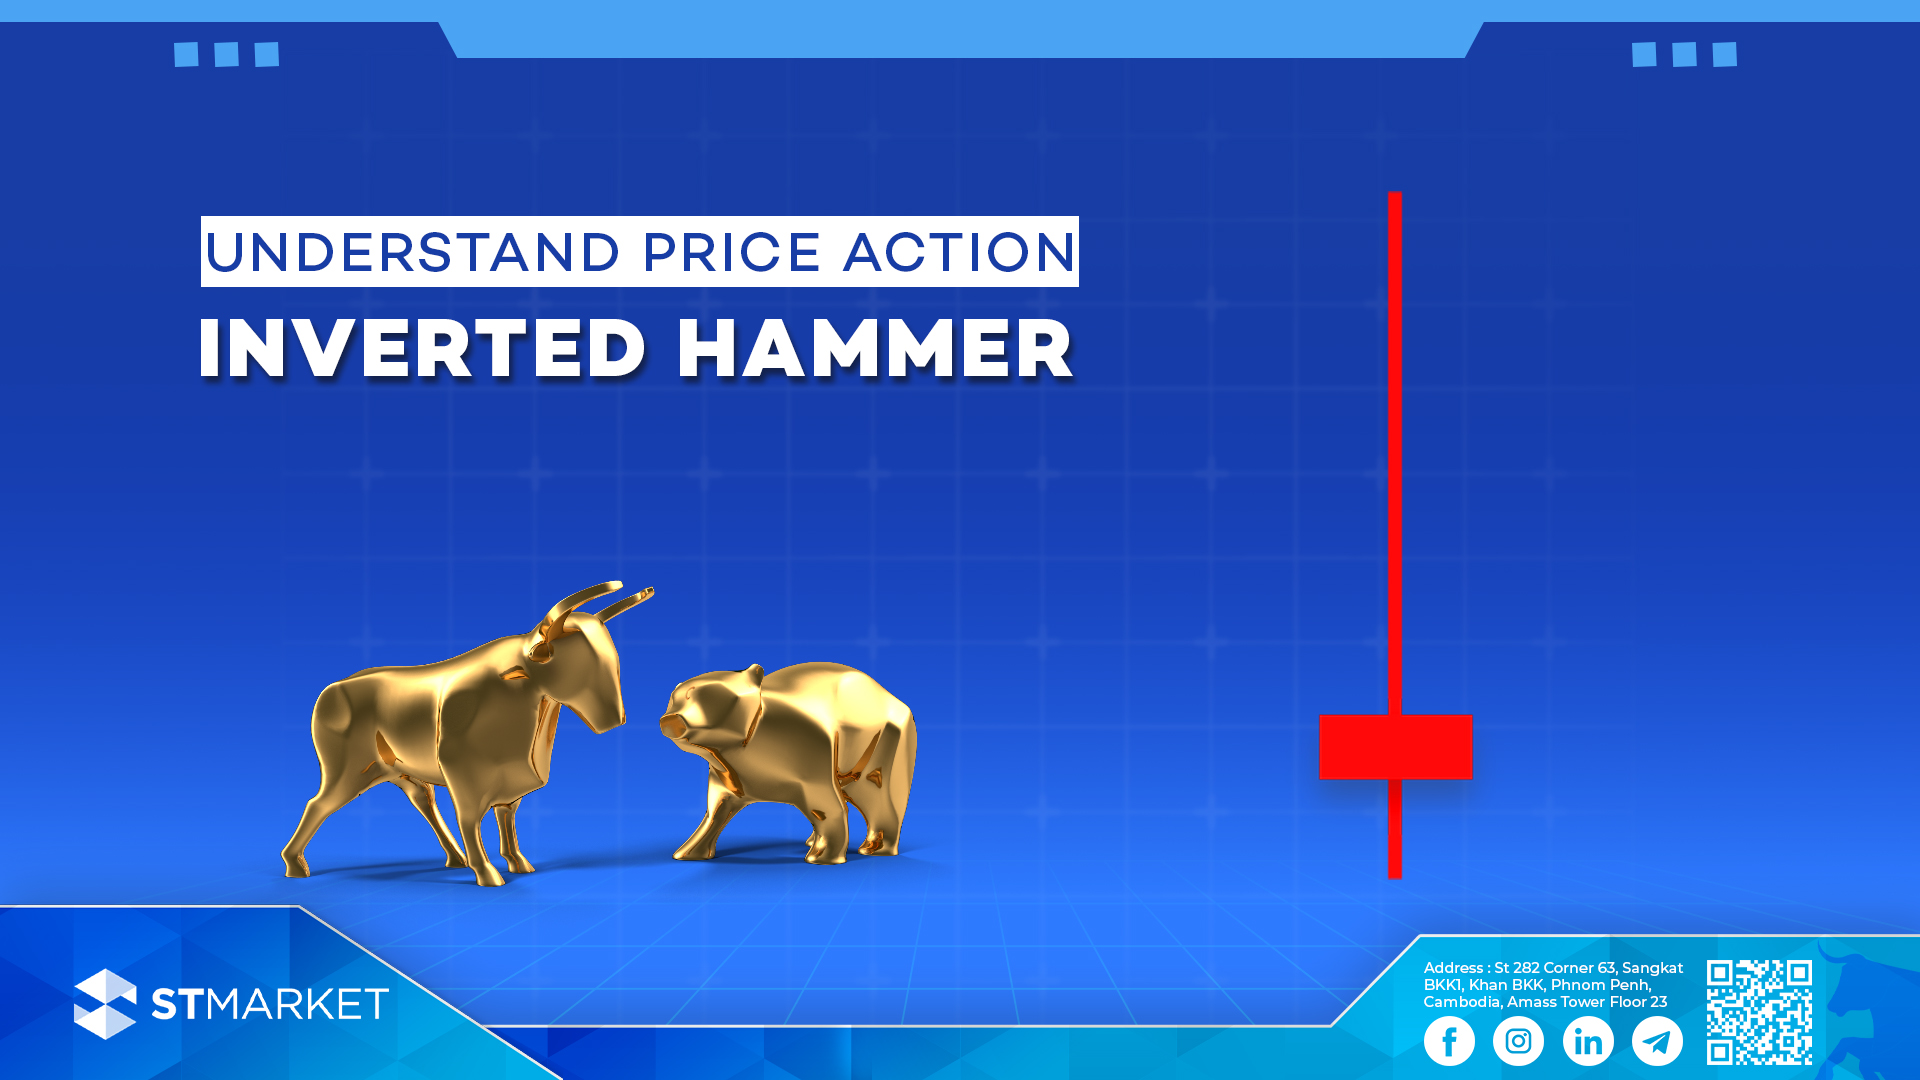
តើអ្វីទៅជា Inverted Hammer Candlestick Pattern? និយមន័យ Inverted Hammer គឺជាប្រភេទនៃ Candle Stick ដែលបង្ហាញពីសញ្ញានៃការវិលត្រឡប់ទៅលំហូរឡើង ពោលគឺការផ្លាស់ប្តូរពីលំហូរចុះទៅលំហូរឡើង។ វាបានផ្តល់នូវសញ្ញាថា អាចនឹងមានលទ្ធភាពដែលតម្លៃអាចនឹងចាប់ផ្តើមកើនឡើង។ រូបរាង លក្ខណៈសម្គាល់ Inverted hammer candlestick pattern គឺជាប្រភេទទានដាច់តែឯងមួយដែលតែងតែលេចឡើងបន្ទាប់ពីលំហូរចុះបានកើតឡើង។ វាមានលក្ខណៈស្រដៀងនឹងHammer Candlestick Pattern ប៉ុន្តែត្រឡប់ក្បាលចុះក្រោម។ ឩទាហរណ៍ ស្រមោលខាងលើនៃInverted hammer បានបង្ហាញពីកម្លាំងអ្នកទិញចូលមកនៅអំឡុងពេលនោះ ហើយតម្លៃត្រឡប់ទៅកៀកកំរិតតម្លៃបើកវិញ។ ទម្រង់ទាននេះផ្តល់សញ្ញាអោយយើងបានដឹងថា អាចនឹងមានការផ្លាស់ប្តូរលំហូរ ដែលប្រាប់យើងថាកម្លាំងអ្នកទិញទំនងជាចុះខ្សោយ ហើយទីផ្សារអាចនឹងផ្លាស់ប្តូរពីលំហូរចុះមកលំហូរឡើងឆាប់ៗ។ នៅក្នុងការសិក្សារមួយធ្វើឡើងដោយ Corey Rosenbloom, CFA, បោះពុម្ភនៅលើវេបសាយ ” Afraid to Trade” inverted hammer pattern បានបង្ហាញពីអត្រាជោគជ័យប្រហែល65%នៅក្នុងការព្យាករណ៍ពីការប្តូរទិសពីចុះមកឡើងវិញ។ ការស្រាវជ្រាវរបស់ Rosenbloom បានវិភាគប្រវត្តិទិន្នន័យរបស់ទីផ្សារភាគហ៊ុនចេញពីទីផ្សារផ្សេងៗដើម្បីឈ្វេងយល់ពីលទ្ធភាព និងទម្រង់ទានដែលគួរឱ្យទុកចិត្តបានជាច្រើនក្នុងនោះមាន inverted hammerផងដែរ។ English Version What is a Hammer Candlestick Pattern? Definition An inverted hammer candlestick pattern is a bullish reversal candlestick pattern that typically forms after a downtrend. It signals that a potential bottom is forming and that the price may start to rise. Appearance Characteristics The inverted hammer candlestick pattern is a single-candle formation that usually appears after a downtrend. It resembles the hammer pattern but has an upside-down appearance. Example The long upper shadow of the inverted hammer indicates that bullish buying pressure surfaced during the session, driving the price back near the opening level. This pattern signals a potential reversal, suggesting that selling pressure may have weakened and the market could be ready for a trend reversal or bullish continuation. In a study by Corey Rosenbloom, CFA, published on the website “Afraid to Trade,” the inverted hammer pattern demonstrated a success rate of around 65% in predicting bullish reversals. Rosenbloom’s research analyzed historical stock data from various markets to assess the performance and reliability of several candlestick patterns, including the inverted hammer.
Understanding Hanging Man Candlestick Patterns
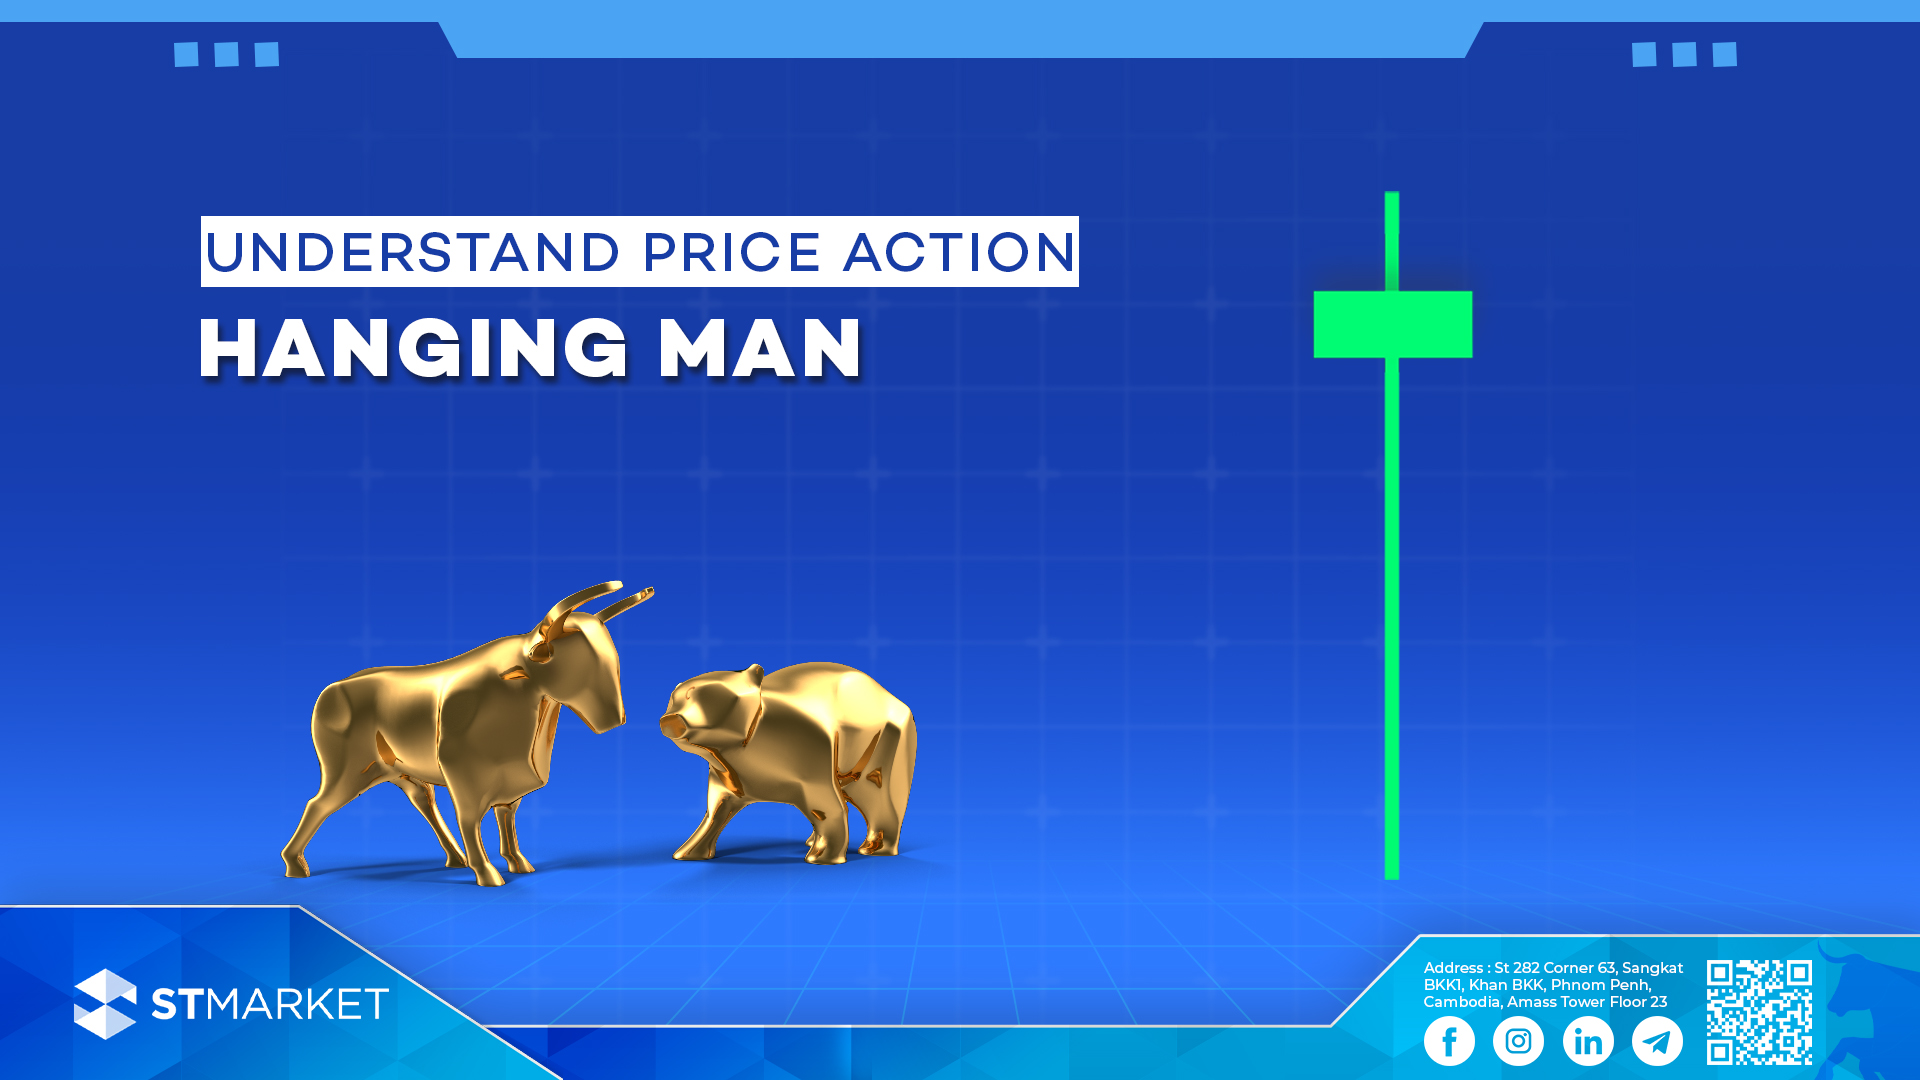
តើអ្វីទៅជា Hanging Man Candlestick Pattern? និយមន័យ Hanging man candlestick pattern គឺជាប្រភេទទានដែលបង្ហាញពីសញ្ញាវិលត្រឡប់ទៅជាលំហូរចុះវិញឬយើងហៅថា វាផ្តល់សញ្ញាថាកំពូលរបស់ទីផ្សារកំពុងកើតឡើងហើយតម្លៃអាចហ្នឹងចាប់ផ្តើមធ្លាក់ចុះ។ រូបរាង លក្ខណៈសម្គាល់ Hanging man candlestick pattern គឺជាប្រភេទទានដាច់តែឯងមួយដែលតែងតែលេចឡើងបន្ទាប់ពីលំហូរឡើងបានកើតឡើង។ វាមានលក្ខណៈដូចទៅនឹងHammer Candlestick Patternតែវាស្ថិតនៅទីតាំងនៅខាងចុងនៃលំហូរឡើង។ ឩទាហរណ៍ ទម្រង់ទាន hanging man កើតឡោះងកំឡុងពេលផ្សាររត់ក្នុងលំហូរឡើងនៅពេលដែលទានដែលមានស្រមោលខាងក្រោមវែងកើតឡើង។ ទានបើក ហើយតម្លៃចាប់ផ្តើមធ្លាក់ចុះ។ ហើយនៅចុងម៉ោង អ្នកទិញព្យាយាមចូលមកវិញរុញតម្លៃទីផ្សារអោយឡើងលើវិញ ធ្វើអោយទានបិទនៅក្បែរតម្លៃបើកវិញ ដែលបង្កើតបានជាស្រមោលខាងក្រោមដ៏វែងដែលយើងហៅទាននេះថា Hanging Man។ ទម្រង់ទាន hanging man ត្រូវបានមើលឃើញថាជាសញ្ញាវិលត្រឡប់ពីឡើងមកចុះនៅក្នុងលំហូរទីផ្សារ បង្ហាញថាមានការចុះក្សោយនៅក្នុងទីផ្សារ ហើយអ្នកទិញកំពុងតែបាត់បង់ការគ្រប់គ្រងលើតម្លៃ។ ស្រមោលខាងក្រោមយ៉ាងវែងបង្ហាញថាអ្នកលក់អាចរុញតម្លៃចុះគួរអោយកត់សម្គាល់ ទោះបីជាអ្នកទិញអាចស្តារតម្លៃបានខ្លះនៅពេលបញ្ចប់សកម្មភាពក៏ដោយ។ ការសិក្សារមួយធ្វើឡើងដោយមជ្ឍមណ្ឌលស្រាវជ្រាវទីផ្សារហិរញ្ញវត្ថុនៅសកលវិទ្យាល័យ Vanderbilt University ក្រោមចំណងជើងថា “Candlestick Patterns and Their Statistical Significance in Financial Markets,” បានរកឃើញថា Hanging Man មានអត្រាជោគជ័យរហូតដល់ 59%ក្នុងការព្យាករណ៍ពីការប្តូរទិសដៅទីផ្សារ។ English Version What is a Hanging Man Candlestick Pattern? Definition A hanging man candlestick pattern is a bearish reversal candlestick pattern that typically forms after an uptrend. It signals that a potential top is forming and that the price may start to fall. Appearance Characteristics The hanging man candlestick pattern is a single-candle formation that usually appears after a uptrend. It resembles the hammer pattern but it happened at the end of the uptrend market. Example The hanging man pattern occurs during an uptrend when a single candlestick with a long lower wick appears. The candle opens, and the price begins to fall. As the session nears its end, bulls try to drive the price back up, causing the candle to close closed to its opening price, which creates the long wick characteristic of the Hanging Man. The hanging man pattern is viewed as a bearish reversal signal, indicating a loss of momentum in the market and that buyers are losing control of prices. The long lower wick shows that bears managed to push the price down considerably, even though bulls managed to recover some ground by the session’s close. A study by the Financial Markets Research Center at Vanderbilt University, featured in their report “Candlestick Patterns and Their Statistical Significance in Financial Markets” found that the Hanging Man pattern has a success rate of around 59% for predicting bearish reversals.
Understanding Three White Soldiers Candlestick Patterns
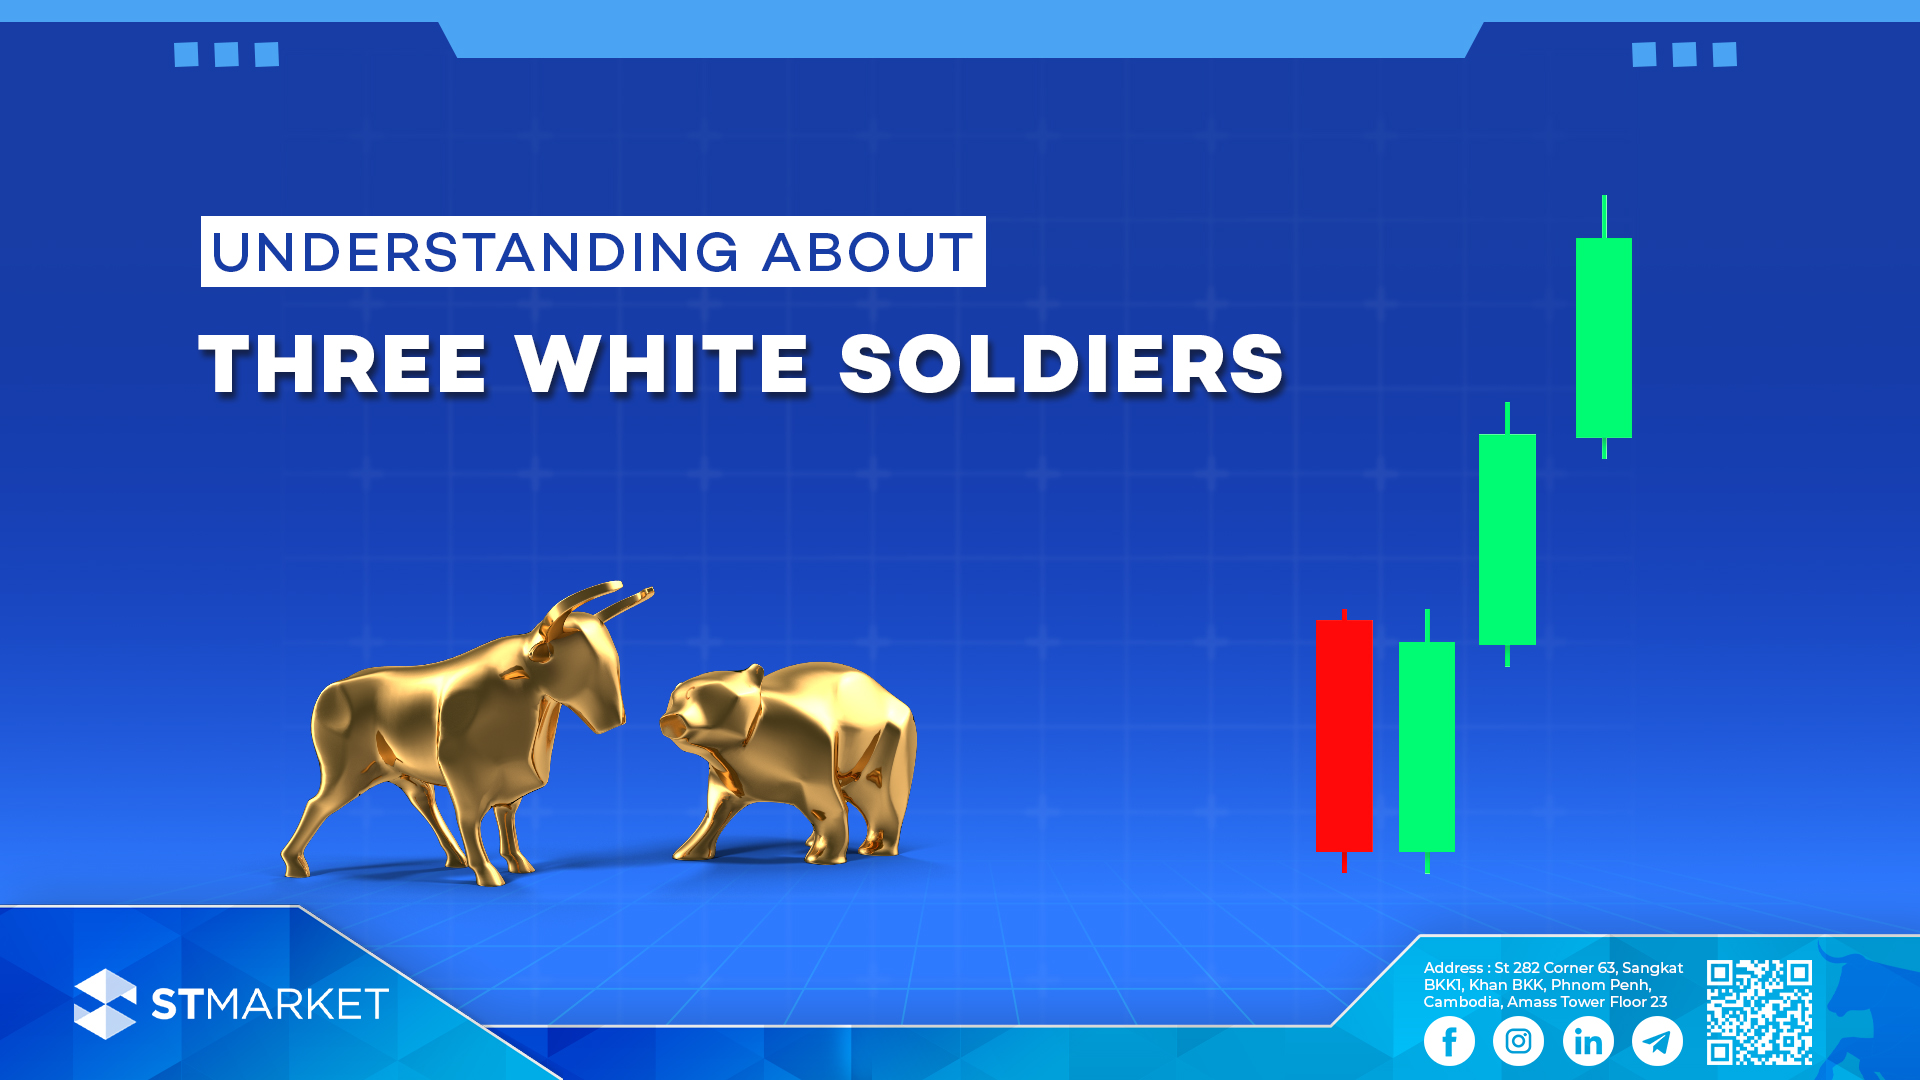
តើអ្វីទៅជា Three White Soldiers Candlestick Pattern? និយមន័យ Three White Soldiers candlestick pattern គឺជាប្រភេទទានដែលបង្ហាញពីសញ្ញាវិលពីលំហូរចុះមកលំហូរឡើងវិញ ដែលជាសញ្ញាបង្ហាញពីលំហូរឡើងហ្នឹងកើតឡើងនៅខាងមុខ។ រូបរាង លក្ខណៈសម្គាល់ Three White Soldiers candlestick patternគឺជាប្រភេទទាន៣រួមគ្នាដែលតែងតែលេចឡើងបន្ទាប់ពីលំហូរចុះ។លក្ខណៈសម្គាល់គឺទានទាំង៣ជាទានឡើងជាប់ៗគ្នាដែលបិទផ្សារនៅតម្លៃខ្ពស់ជាងមុនជានិច្ច។ វាកើតឡើងនៅខាងចុងនៃលំហូរចុះ។ ឩទាហរណ៍ របៀប Three White Soldiers ត្រូវបានបង្កើតឡើងនៅពេលដែលសន្ទស្សន៍អារម្មណ៍ទីផ្សារផ្លាស់ប្តូរយ៉ាងខ្លាំងពីសន្ទស្សន៍អារម្មណ៍ចុះទៅជាសន្ទស្សន៍អារម្មណ៍កើនឡើងវិញ។ ដំបូង វិនិយោគិនអាចមានអារម្មណ៍អវិជ្ជមាន ដោយសារតែមានការធ្លាក់ចុះនៃទីផ្សារ ប៉ុន្តែបន្ទាប់មកមានទម្រង់ទានThree White Soldiersដែលមានការបិទខ្ពស់ឡើងៗ បង្ហាញថាអ្នកទិញបានចាប់ផ្ដើមកាន់កាប់ទីផ្សារហើយ។ របៀបនេះជាសញ្ញានៃការផ្លាស់ប្តូរអារម្មណ៍ចេញពីលំហូរចុះមកជាលំហូរឡើងវិញ។ ការសិក្សាមួយដែលមានចំណងជើង “Candlestick Patterns and Market Trends: An Empirical Study” ធ្វើឡើងដោយTechnical Analysis Research & Education (TARE) Foundation) បានរកឃើញថា Three White Soldiers patternមានអត្រាជោគជ័យប្រហែលជា 82% ក្នុងការព្យាករណ៍ថាទីផ្សារនឹងប្តូរពីលំហូរចុះមកឡើងវិញ។ English Version What is a Three White Soldiers candlestick Pattern? Definition Three White Soldiers candlestick pattern is a bullish reversal candlestick pattern that typically forms after a downtrend. It signals that a potential bullish trend is forming and that the price may start to rise. Appearance Characteristics Three White Soldiers candlestick pattern is a three candlestick formation that usually appears after a downtrend. It consists of three consecutive bullish candlestick pattern with higher closes. It is formed at the end of a downtrend. Example The Three White Soldiers pattern forms when market sentiment undergoes a strong shift from bearish to bullish. Initially, a bearish decline may lead to investor pessimism, but it is followed by three consecutive bullish candles with rising closes, indicating that buyers have gained control. This pattern often signals a potential reversal of the downtrend. A study titled “Candlestick Patterns and Market Trends: An Empirical Study” by the Technical Analysis Research & Education (TARE) Foundation found that the Three White Soldiers pattern has an approximate 82% success rate in predicting bullish reversals.
Understanding Three Black Crows Candlestick Patterns
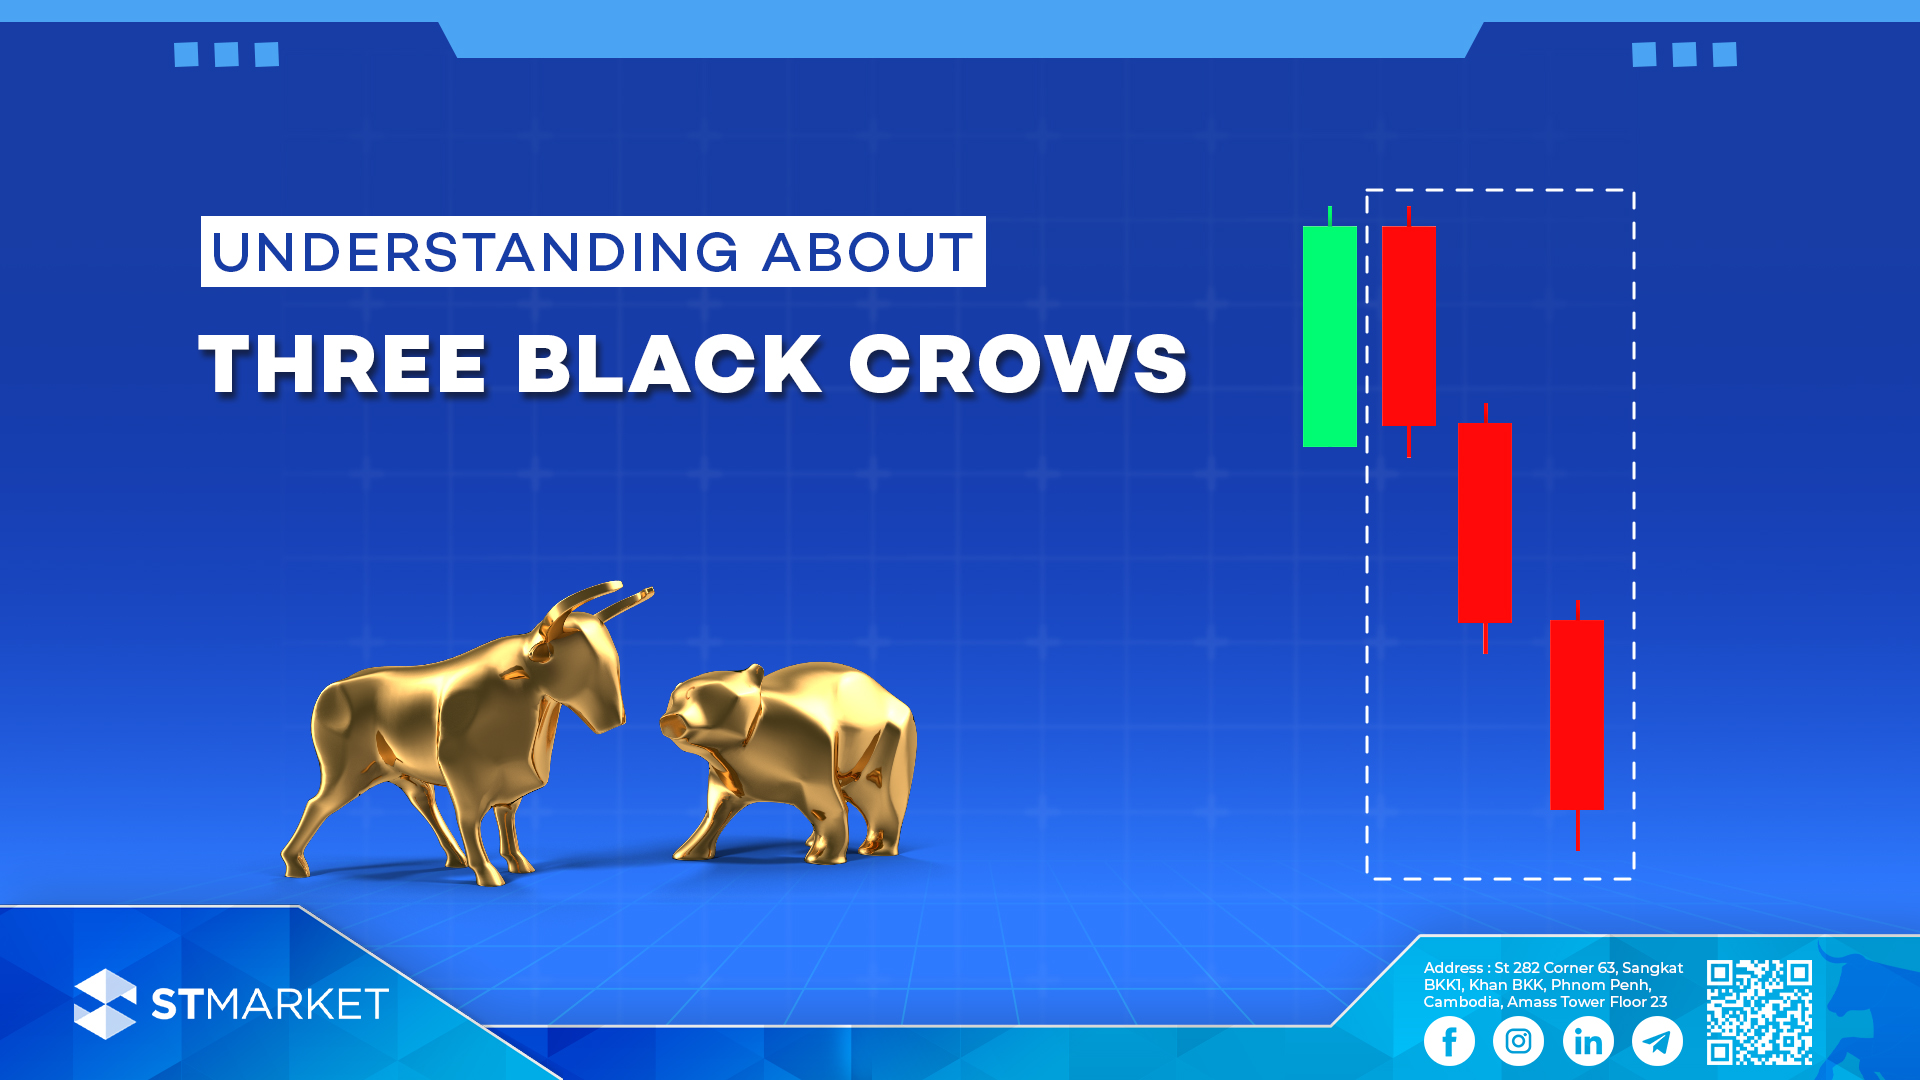
តើអ្វីទៅជា Three Black Crows Candlestick Pattern? និយមន័យ Three Black Crows candlestick pattern គឺជាប្រភេទទានដែលបង្ហាញពីសញ្ញាវិលពីលំហូរឡើងមកលំហូរចុះវិញ ដែលជាសញ្ញាបង្ហាញពីលំហូរចុះនឹងកើតឡើងនៅពេលខាងមុខ។ រូបរាង លក្ខណៈសម្គាល់ Three Black Crows candlestick patternគឺជាប្រភេទទាន៣រួមគ្នាដែលតែងតែលេចឡើងបន្ទាប់ពីលំហូរចុះ។លក្ខណៈសម្គាល់គឺទានទាំង៣ជាទានឡើងជាប់ៗគ្នាដែលបិទផ្សារនៅតម្លៃទាបជាងមុនជានិច្ច។ វាកើតឡើងនៅខាងចុងនៃលំហូរឡើង។ ឩទាហរណ៍ ទានឡើងដំបូងមុនពេល Three Black Crows កើតឡើងបានបង្ហាញពីអារម្មណ៍វិជ្ជមានចំពោះអ្នកវិនិយោគ ទោះយ៉ាងណាក៏ដោយនៅពេលដែលការលេចចេញឡើងនៃទានចុះចំនួនបីជាប់ៗគ្នាដែលទាបជាងមុនជានិច្ចបានផ្តល់សញ្ញាប្រាប់ថាអ្នកលក់អាចនឹងកំពុងចូលមកគ្រប់គ្រង។ ទម្រង់នេះប្រាប់យើងថាអាចនឹងមានការប្តូរទិសមកពីលំហូរឡើងទៅជាលំហូរចុះវិញ។ យោងតាមការសិក្សាក្រោមចំណងជើងថា“An Analysis of Candlestick Patterns in Market Forecasting” ធ្វើឡើងដោយក្រុមស្រាវជ្រាវនៅឯទស្សនាវត្តីTechnical Analysis of Stocks & Commodities (TASC) បង្ហាញថា ទម្រង់ទានThree Black Crows មានអត្រាជោគជ័យរហូតដល់ទៅ78% ក្នុងការព្យាករណ៍ថានឹងមានការប្តូរទិសមកចុះវិញ។ English Version What is a Three Black Crows candlestick Pattern? Definition Three Black Crows candlestick pattern is a bearish reversal candlestick pattern that typically forms after an uptrend. It signals that a potential bearish trend is forming and that the price may start to falls. Appearance Characteristics Three Black Crows candlestick pattern is a three candlestick formation that usually appears after an uptrend. It consists of three consecutive bearish candlestick pattern with lower closes. It is formed at the end of an uptrend. Example The initial bullish rally preceding the Three Black Crows pattern sparks optimism among investors; however, the appearance of three consecutive bearish candles with progressively lower lows signals that bears may be taking control. This pattern suggests a possible reversal of the prevailing uptrend. According to the study “An Analysis of Candlestick Patterns in Market Forecasting” by the research team at Technical Analysis of Stocks & Commodities (TASC) magazine, the Three Black Crows pattern has about a 78% success rate in forecasting bearish reversals.
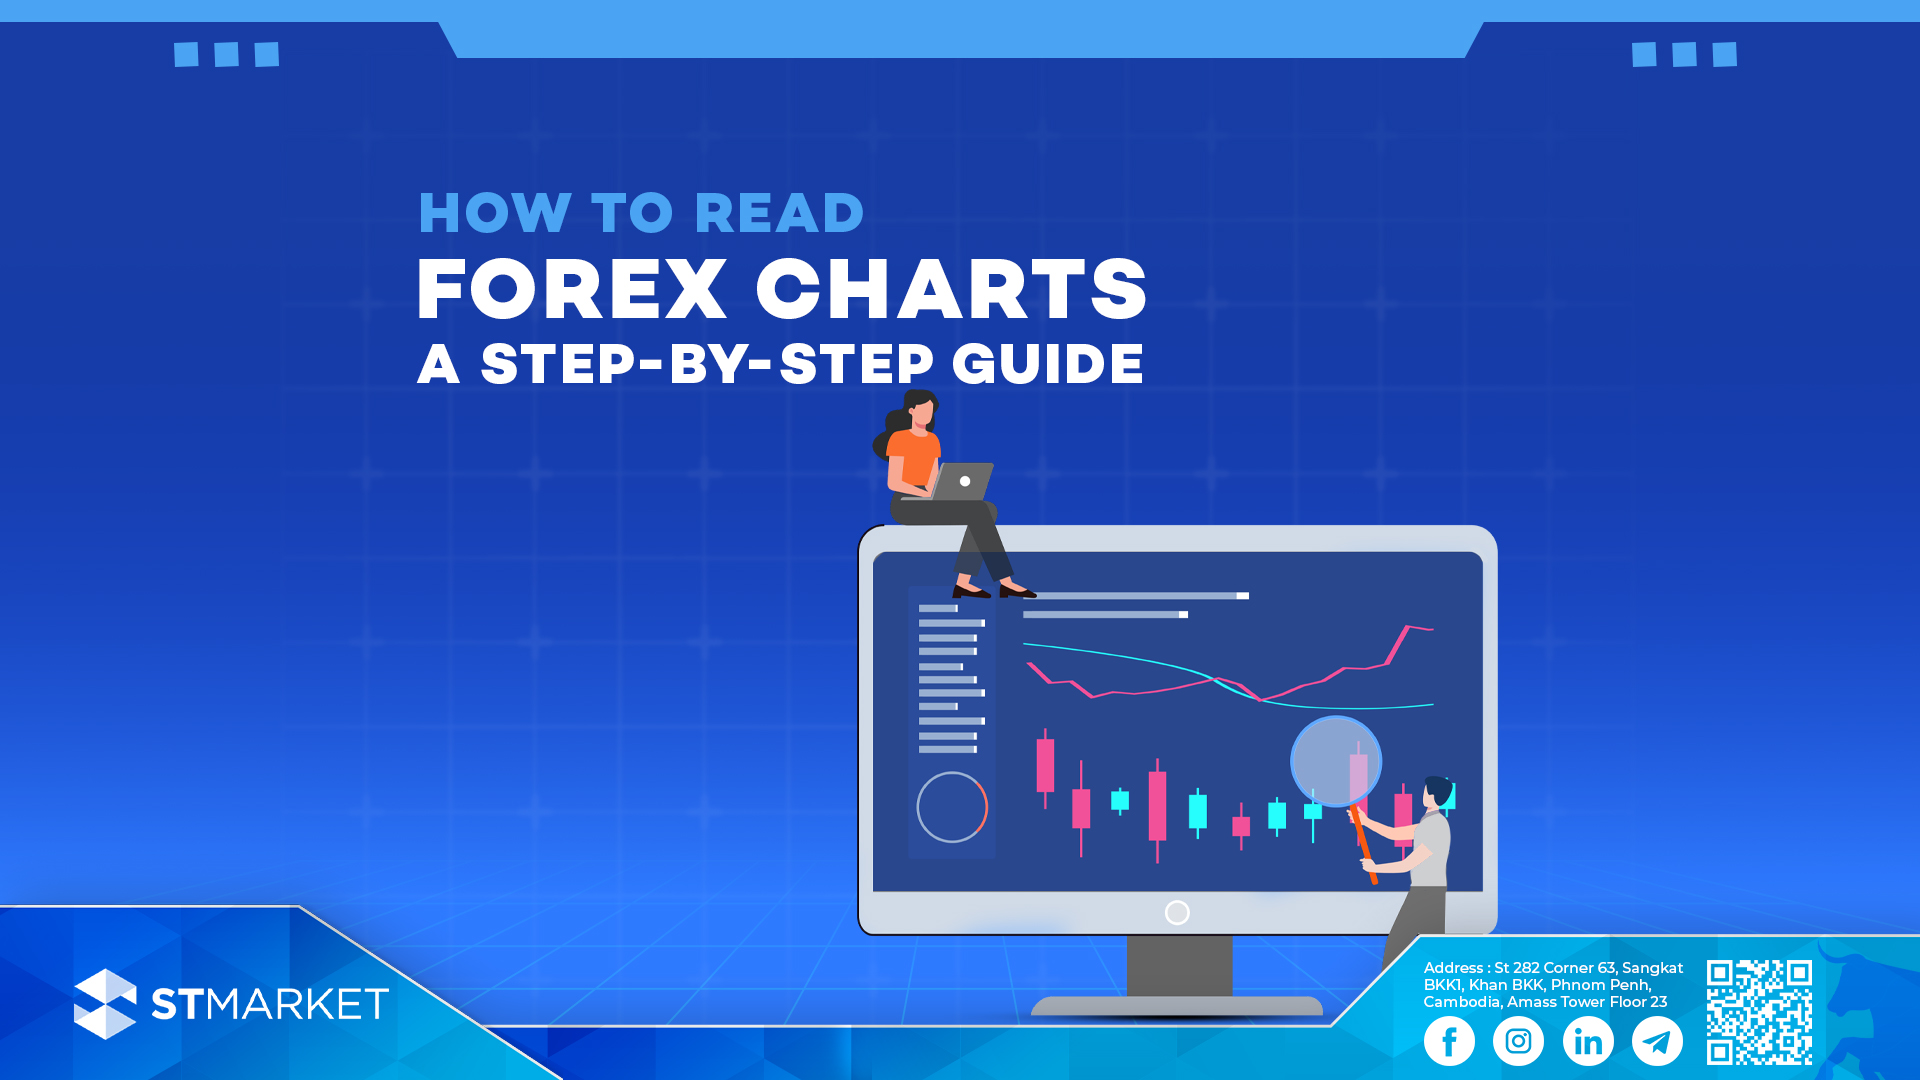
How to Read Forex Charts: A Step-by-Step Guide
យល់ដឹងពីការអានទីផ្សារ Forex គឺមានសារៈសំខាន់សម្រាប់អ្នកជួញដូរ។ ម្យ៉ាងវិញទៀត ប្រសិនបើអ្នកជាអ្នកចាប់ផ្តើមដំបូង ឬក៏កំពុងស្វែងរកការកែលម្អជំនាញរបស់អ្នក ជំនួញនេះនឹងនាំអ្នកទៅកាន់ដំណាក់កាលនៃការអានទីផ្សារ Forex និងការបកស្រាយចលនាដឹកនាំតម្លៃនៃទីផ្សារ។ ១.”យល់ដឹងពីមូលដ្ឋាននៃតារាង Forex” តារាងទីផ្សារ Forex បង្ហាញពីចលនាតម្លៃរបស់គូរូបិយប័ណ្ណក្នុងរយៈពេលកំណត់។ តារាងទាំងនេះបង្ហាញទិន្នន័យប្រវតិ្តនៃទីផ្សារ ដែលអនុញ្ញាតឱ្យអ្នកជួញដូរវិភាគការសម្រេចចិត្តនៃការលក់និងការជួញដូរ។ ប្រភេទតារាងទីផ្សារ Forex ដែលពេញនិយមបំផុតមាន៖ – “តារាងជាបន្ទាត់(line chart)”: តារាងសាមញ្ញបំផុតដែលបង្ហាញតម្លៃបិទនៃការជួញដូរក្នុងរយៈពេលមួយ។ – “តារាងជារបារ(bar chart)”: បង្ហាញពីតម្លៃបើក, ខ្ពស់, ទាប និងបិទសម្រាប់រយៈពេលជាក់លាក់មួយ។វាផ្ដល់ព័ត៌មានលម្អិតជាងline chart – “តារាងជា Candlestick”: ប្រភេទគំនូសតាងដ៏ពេញនិយមបំផុតក្នុងចំណោមពាណិជ្ជករ វាក៏បង្ហាញទិន្នន័យ OHLC ផងដែរ ប៉ុន្តែជាទម្រង់ទាក់ទាញដែលមើលឃើញជាមួយនឹង “ទាន” ដែលតំណាងឱ្យរយៈពេលនីមួយៗ។ ២. “ស្គាល់ពីរយៈពេលនីមួយៗ” តារាង Forex មានរយៈពេលផ្សេងៗគ្នា ដោយចាប់ពីនាទីទៅខែ។ ជាអ្នកជួញដូរ អ្នកត្រូវតែសម្រេចចិត្តថាតើរយៈពេលណាដែលសាកសមសម្រាប់ស្ទាយការជួញដូររបស់អ្នក។ ៣. “សិក្សាអំពី candlestick pattern” តារាងcandlestick ត្រូវបានគេចូលចិត្តយ៉ាងខ្លាំងដោយអ្នកជួញដូរពីព្រោះវាផ្តល់ការយល់ឃើញអំពីមូលដ្ឋាននៃអារម្មណ៍ទីផ្សារ។ -“តួនៃcandlestick(Body)” ជាផ្នែកដែលធំជាងគេនៃcandlestick ដែលអាចបង្ហាញឲ្យដឹងពីតម្លៃនៃការបិទនឹងបើកនៃការជួញដូរ។ - “ស្រមោលនៃទាន candlestick(shadows)” ជាខ្សែឬស្រមោលមានលក្ខណៈជាបន្ទាត់ដែលនៅពីលើនឹងពីក្រោមBody ដែលបង្ហាញពីតម្លៃដែលខ្ពស់បំផុតនឹងទាបបំផុតនៃការជួរដូរ។ -“បង្គោលឡើង (bullish candlestick)” ជាបង្គោលនៅពេលដែលបិទខ្ពស់ជាងពេលបើកដែលមានបង្គោលពណ៌សឬពណ៌បៃតង។ – “បង្គោលចុះ (bearish candlestick)” ជាបង្គោលនៅពេលដែលបិទទាបជាងពេលបើកដែលមានបង្គោលពណ៌ខ្មៅនឹងពណ៌ក្រហមជាសម្គាល់។ ការសិក្សាពី candlestickនៃទម្រង់រូបរាងវាដូចជា hammer Doji or Engulfing អាចជួយអ្នកក្នុងការមើលទីផ្សារទៅមុខទៀត។ ៤. “សម្គាល់កម្រិតបាត និង តំបូល ( support and resistance) បាត និង ដំបូល គឺជាគំនិតសំខាន់ៗនៅក្នុងការជួញដូរ Forex ដែលអ្នកជួញដូរត្រូវតែយល់ពីវា។ –“support” ជាកម្រិតតម្លៃនៅពេលដែលផ្សារកំពុងធ្លាក់ចុះហើយត្រូវបានផ្អាកព្រោះមានការទិញឡើងវិញ។ – “Resistance” ជាកម្រិតតម្លៃនៅពេលដែលផ្សារកំពុងឡើងហើយត្រូវផ្អាកព្រោះមានការលក់វិញ។ កម្រិតទាំងនេះមានសារៈសំខាន់ណាស់ ព្រោះវាបង្ហាញពីកន្លែងដែលតម្លៃអាចបញ្ច្រាស់ ឬជាប់គាំង ដោយផ្តល់ឱ្យឈ្មួញនូវឱកាសក្នុងការចូល ឬចាកចេញពីការជួញដូរ។ ៥. “ប្រើសូចនាករបច្ចេកទេស” សូចនាករបច្ចេកទេសគឺជាការគណនាគណិតវិទ្យាដោយផ្អែកលើតម្លៃ បរិមាណ ឬចំណាប់អារម្មណ៍បើកចំហ នៃគូរូបិយប័ណ្ណ។ សូចនាករពេញនិយមបំផុតមួយចំនួនរួមមាន: -“Moving Average “៖ ធ្វើឱ្យទិន្នន័យតម្លៃដំណើរការរលូនដើម្បីកំណត់និន្នាការក្នុងរយៈពេលជាក់លាក់ណាមួយ។ – “Relative Strength Index (RSI)” សូចនាករសន្ទុះដែលបង្ហាញថាតើរូបិយប័ណ្ណត្រូវបានទិញលើស ឬលក់លើស។ – “MACD (Moving Average Convergence Divergence)”៖ សូចនាករសន្ទុះតាមនិន្នាការដែលជួយកំណត់សញ្ញាទិញ និងលក់សក្តានុពលនៃផ្សារ។ ៦. “ប្រើការវិភាគតម្លៃជាមួយនឹងសូចនាករបច្ចេកទេស(Technical Indicator)” Trader ដែលទទួលបានជោគជ័យបំផុតតែងតែរួមបញ្ចូលគ្នានូវសកម្មភាពតម្លៃទីផ្សារជាមួយនឹងសូចនាករបច្ចេកទេសដើម្បីធ្វើឱ្យការព្យាករណ៍កាន់តែត្រឹមត្រូវ។ សកម្មភាពតម្លៃពាក់ព័ន្ធនឹងការសិក្សាអំពីចលនានៃតម្លៃរបស់ផ្សារ ខណៈពេលដែលសូចនាករផ្តល់ការបញ្ជាក់បន្ថែមចំពោះការវិភាគរបស់អ្នក។ ៧. “ការអនុវត្ត និងបទពិសោធន៍” មធ្យោបាយដ៏ល្អបំផុតដើម្បីកាន់តែប្រសើរឡើងក្នុងការអានទីផ្សារ Forex គឺតាមរយៈការអនុវត្ត។ ប្រើគណនីសាកល្បង(Demo Account) ដើម្បីសាកល្បងជាមួយប្រភេទតារាងផ្សារ ពេលវេលា និងសូចនាករ(Indicator) ផ្សេងៗ។ យូរៗទៅ អ្នកនឹងអភិវឌ្ឍការយល់ដឹងកាន់តែប្រសើរឡើងអំពីឥរិយាបថឬចលនាទីផ្សារ និងរបៀបធ្វើការសម្រេចចិត្តជួញដូរកាន់តែឆ្លាតវៃ។ សេចក្តីសន្និដ្ឋាន ការអានតារាង Forex គឺជាជំនាញដ៏មានតម្លៃសម្រាប់ Trader។ តាមរយៈការយល់ដឹងអំពីមូលដ្ឋានគ្រឹះនៃប្រភេទតារាងផ្សារ ពេលវេលា លំនាំនៃCandlestick និងសូចនាករបច្ចេកទេស(Indicator) អ្នកអាចអភិវឌ្ឍន៍សមត្ថភាពរបស់អ្នកក្នុងការសម្រេចចិត្តជួញដូរ។ សូមចងចាំថាការអនុវត្តធ្វើឱ្យមានបទពិសោធន៍ល្អ—ដូច្នេះត្រូវចំណាយពេលដើម្បីស្គាល់ខ្លួនអ្នកជាមួយនឹងការអានតារាងផ្សារ និងកែលម្អយុទ្ធសាស្រ្តរបស់អ្នកតាមពេលវេលា។ |English Version| Understanding Forex charts is crucial for any trader who wants to make informed decisions in the foreign exchange market. Whether you’re a beginner or looking to refine your skills, this step-by-step guide will walk you through the basics of reading Forex charts and interpreting price movements. 1.“Understand the Basics of Forex Charts” Forex charts visually represent the price movements of currency pairs over a specific time period. These charts display historical data, allowing traders to analyze past performance and predict future price trends. The most common types of Forex charts are: – “Line Chart”: This is the simplest form of chart, showing the closing prices over time. It’s ideal for getting an overview of price trends. – “Bar Chart”: This chart shows the open, high, low, and close prices (OHLC) for a specific period. It provides more detailed information than the line chart. – “Candlestick Chart”: The most popular chart type among traders, it also shows OHLC data but in a visually appealing format with “candlesticks” that represent each time period. Forex charts come in various time frames, ranging from seconds to months. As a trader, you’ll need to decide which time frame is best for your trading style. Common time frames include: – “1-minute chart (M1)” – “5-minute chart (M5)” – “15-minute chart (M15)” – “1-hour chart (H1)” – “4-hour chart (H4)” – “Daily chart (D1)” Shorter time frames are ideal for scalpers and day traders, while longer time frames are favored by swing traders and position traders. Candlestick charts are favored by most traders because they provide clear insight into market sentiment. Each candlestick represents a certain time period and contains the following components: – “Body”: The thick part of the candlestick, showing the open and close prices. – “Wicks (or Shadows)”: The thin lines above and below the body, showing the highest and lowest prices during the period. – “Bullish Candlestick”: When the close is higher than the open, typically shown in green or white. – “Bearish Candlestick”: When the close is lower than the open, typically shown in red or black. Learning to recognize common candlestick patterns such as Doji, Engulfing, and Hammer can help you predict price movements more accurately. Support and resistance are key concepts in Forex trading. – “Support”: A price level where a downtrend can be expected to pause due to a concentration of buying interest. – “Resistance”: A price level where a trend is expected to pause or reverse due to a concentration of selling interest. These levels are crucial because they indicate where price may reverse or stall, giving traders opportunities to enter or exit trades. Technical indicators are mathematical calculations based on the price, volume, or open interest of a currency pair. Some of the most popular indicators include: – “Moving Averages”: These smooth out price data to identify trends over a specific period. – “Relative Strength Index (RSI)”: A momentum indicator that shows whether a currency is overbought or oversold. – “MACD (Moving Average Convergence Divergence)”: A trend-following momentum indicator that helps identify potential buy and sell signals. The most successful traders often combine price action with technical indicators to make more accurate predictions. Price action involves studying the movement of the price itself, while indicators provide additional confirmation to your analysis. The best way to get better at reading Forex charts is through practice. Use demo accounts to experiment with different chart types, time frames, and indicators. Over time, you’ll develop a better sense of market behavior and how to make smarter trading decisions. Conclusion Reading Forex charts is a valuable skill for any trader. By understanding the basics of chart types, time frames, candlestick patterns, and technical indicators, you can improve your ability to make informed trading decisions. Remember, practice makes perfect—so take the time to familiarize yourself with chart reading and refine your strategy over time.
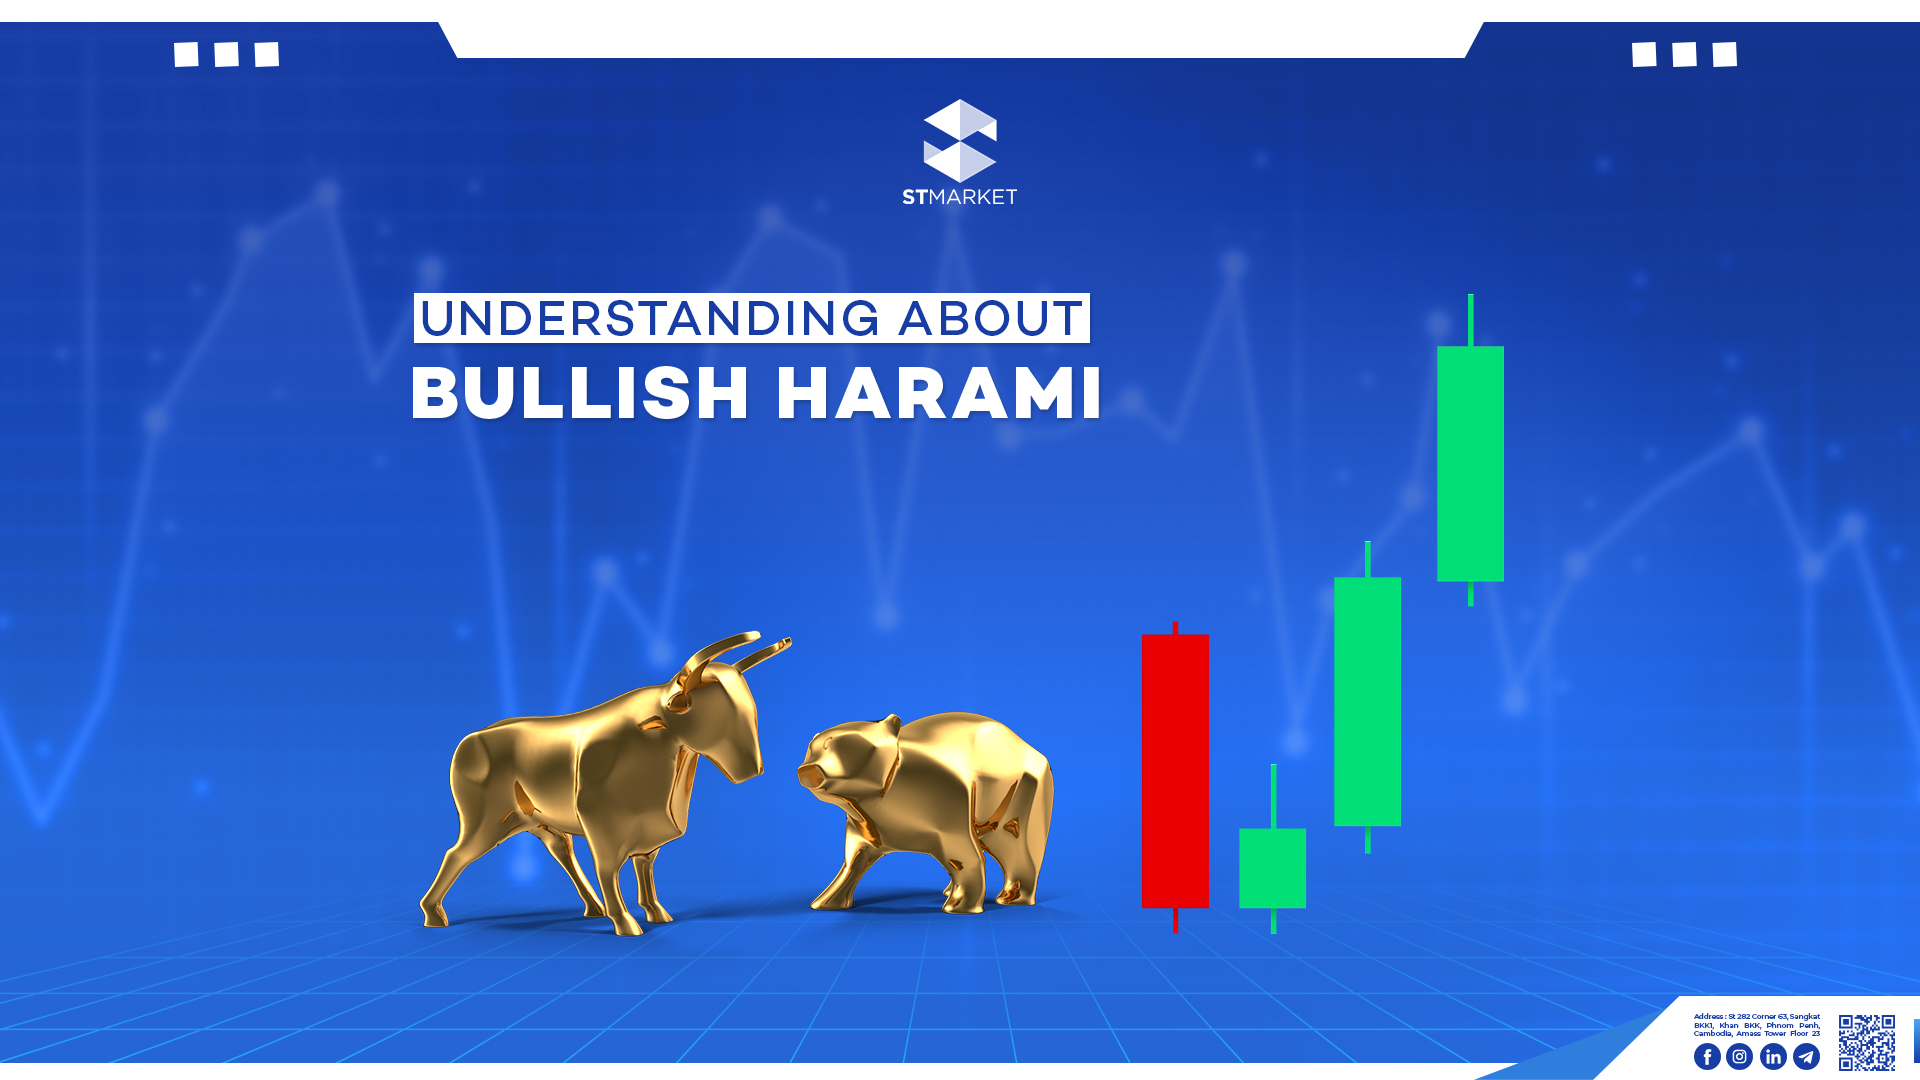
Understanding Bullish Harami Candlestick Patterns
តើអ្វីទៅជា Bullish Harami Candlestick Pattern? និយមន័យ Bullish Harami Patternបង្ហាញពីភាពមិនប្រាកដរបស់អ្នកចូលរួមក្នុងទីផ្សារ។ វាក៏បង្ហាញថាសម្ពាធលក់កំពុងធ្លាក់ចុះ ហើយអ្នកទិញកំពុងចូលមកគ្រប់គ្រងក្នុងទីផ្សារ។ រូបរាង លក្ខណៈសម្គាល់ ទម្រង់ទាន Bullish Harami ផ្ទុកទៅដោយទាន២។ វាត្រូវបានសម្គាល់ដោយទានដែលមានតួរខ្លួនតូចមួយកើតឡើងនៅក្នុងចន្លោះនៃតួខ្លួនរបស់ទានធំមួយ។ ទម្រង់នេះតែងតែកើតឡើងនៅខាងចុងនៃលំហូរចុះ ដែលផ្តល់សញ្ញាប្រាប់យើងថាអាចនឹងមានការប្តូរទិសដៅរពីចុះមកឡើងវិញ។ ឩទាហរណ៍ នៅក្នុងការសិក្សាមួយក្រោមប្រធានបទ“Encyclopaedia of Candlestick Charts” ធ្វើឡើងដោយលោក N. Bulkowski បានរកឃើញថាទម្រង់ទាន Bullish Harami មានអត្រាជោគជ័យរហូតដល់ទៅ 54% នៅក្នុងការព្យាករណ៍ពីការផ្លាស់ប្តូរលំហូរ។ តួរលេខនេះគឺយោងទៅតាមការវិភាគនិងតេស្តសាកល្បងទៅលើប្រវត្តិតម្លៃ ដែលវាបានចង្អុលបង្ហាញថារាល់ពេលដែល Bullish Harami កើតឡើងវាតែងតែផ្តល់សញ្ញាប្រាប់យើងថានឹងមានការវិលត្រឡប់កើតឡើង។ English Version What is Bullish Harami candlestick Pattern? Definition The Bullish Harami Pattern reflects uncertainty among market participants. It also signals a decline in selling pressure, with buyers gradually gaining control of the market. Appearance Characteristics The Bullish Harami candlestick pattern consists of two candles. It is defined by a small green-bodied candle forming within the range of a preceding larger red-bodied candle. This pattern typically appears at the bottom of a chart, signaling a possible reversal from a bearish trend to a bullish one. Example In his study, “Encyclopaedia of Candlestick Charts”, Thomas N. Bulkowski found that the bullish harami pattern has a success rate of about 54% in predicting market reversals. This figure, based on extensive backtesting and analysis, highlights the bullish harami pattern’s value in technical analysis, as it frequently indicates a potential shift from bearish to bullish market sentiment.
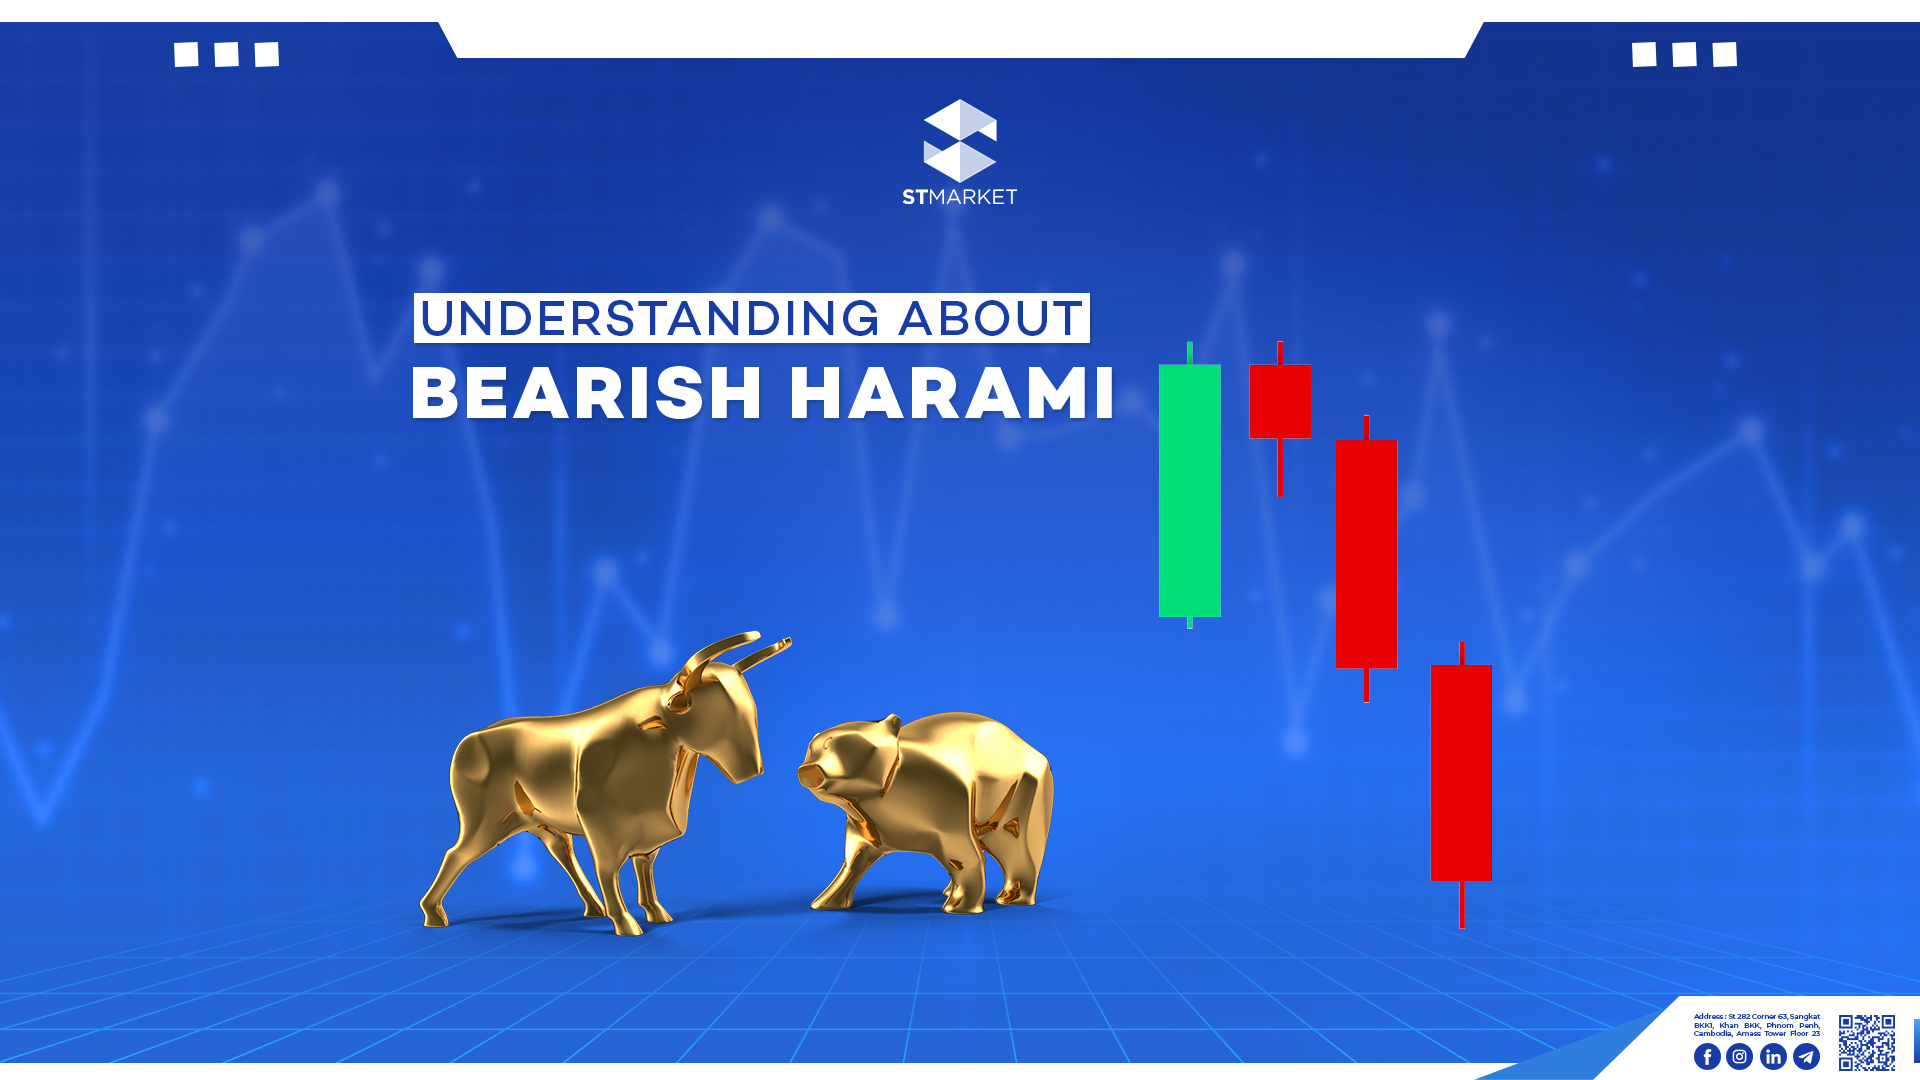
Understanding Bearish Harami Candlestick Patterns
តើអ្វីទៅជា Bearish Harami Candlestick Pattern? និយមន័យ Bearish Harami Patternបង្ហាញពីភាពមិនប្រាកដរបស់អ្នកចូលរួមក្នុងទីផ្សារ។ វាក៏បង្ហាញថាសម្ពាធអ្នកទិញកំពុងធ្លាក់ចុះ ហើយអ្នកលក់កំពុងចូលមកគ្រប់គ្រងក្នុងទីផ្សារ។ រូបរាង លក្ខណៈសម្គាល់ ទម្រង់ទាន Bearish Harami ផ្ទុកទៅដោយទាន២។ វាត្រូវបានសម្គាល់ដោយទានក្រហមដែលមានតួរខ្លួនតូចមួយកើតឡើងនៅក្នុងចន្លោះនៃតួខ្លួនរបស់ទានឡើងធំមួយ។ ទម្រង់នេះតែងតែកើតឡើងនៅខាងចុងនៃលំហូរឡើង ដែលផ្តល់សញ្ញាប្រាប់យើងថាអាចនឹងមានការប្តូរទិសដៅរពីឡើងមកចុះវិញ។ ឩទាហរណ៍ ទម្រង់ទាន Bearish Harami គឺជាសូចនាករចង្អុលបង្ហាញពីកម្លាំងអ្នកលក់ខ្លាំង ដែលបង្ហាញថាទីផ្សារអាចនឹងខិតជិតដល់ចំណុចកំពូល ឬកម្រិតខ្ពស់គួរឱ្យកត់សម្គាល់។ទានមានការកើនឡើងធំឆ្លុះបញ្ចាំងពីសម្ពាធទិញដ៏ខ្លាំង ខណៈពេលដែលទានធ្លាក់ចុះតូចជាងដែលនៅខាងក្រោមបង្ហាញថាអ្នកលក់កំពុងទទួលបានការគ្រប់គ្រង និងជំរុញឱ្យតម្លៃធ្លាក់ចុះ។ គំរូនេះច្រើនតែត្រូវបានប្រៀបធៀបទៅនឹងលំនាំការធ្លាក់ចុះនៃការធ្លាក់ចុះ ដោយសារតែទាំងពីរនេះបង្ហាញពីលទ្ធភាពនៃទីផ្សារជិតដល់កំពូល ឬកម្រិតខ្ពស់គួរឱ្យកត់សម្គាល់។ តាមការសិក្សារមួយក្រោមប្រធានបទ “The Effectiveness of Candlestick Patterns in Financial Markets” ស្រាវជ្រាវដោយលោកសាស្រ្តាចារ្យ Wing-Keung Wong និងក្រុមស្រាវជ្រាវរបស់លោកដែលមកពីដេប៉ាតេម៉ងផ្នែកសេដ្ឋកិច្ចនៅសកលវិទ្យាល័យ Hong Kong Baptist University បានរកឃើញថាទម្រង់ទាន bearish harami មានអត្រាជោគជ័យរហូតដល់ ៦៣%ក្នុងការព្យាករណ៍ពីការផ្លាស់ប្តូរទិសដៅពីលំហូរឡើងមកជាលំហូរចុះវិញ។ English Version What is Bearish Harami candlestick Pattern? Definition The Bearish Harami Pattern reflects uncertainty among market participants. It also signals a decline in buying pressure, with sellers gradually gaining control of the market. Appearance Characteristics The Bearish Harami candlestick pattern consists of two candles. It is defined by a small red-bodied candle forming within the range of a preceding larger green-bodied candle. This pattern typically appears at the top of a chart, signaling a possible reversal from a bullish trend to a bearish one. Example The bearish harami pattern is a strong bearish indicator, signaling that the market may be approaching a peak or a significant high. The large bullish candlestick reflects strong buying pressure, while the smaller bearish candlestick that follows indicates that sellers are gaining control and pushing prices downward. This pattern is often compared to the bearish engulfing pattern, as both suggest the possibility of the market nearing a top or a notable high. A study titled “The Effectiveness of Candlestick Patterns in Financial Markets”, led by Professor Wing-Keung Wong and his team from the Department of Economics at Hong Kong Baptist University, found that the bearish harami pattern has an approximate 63% success rate in predicting bearish reversals.
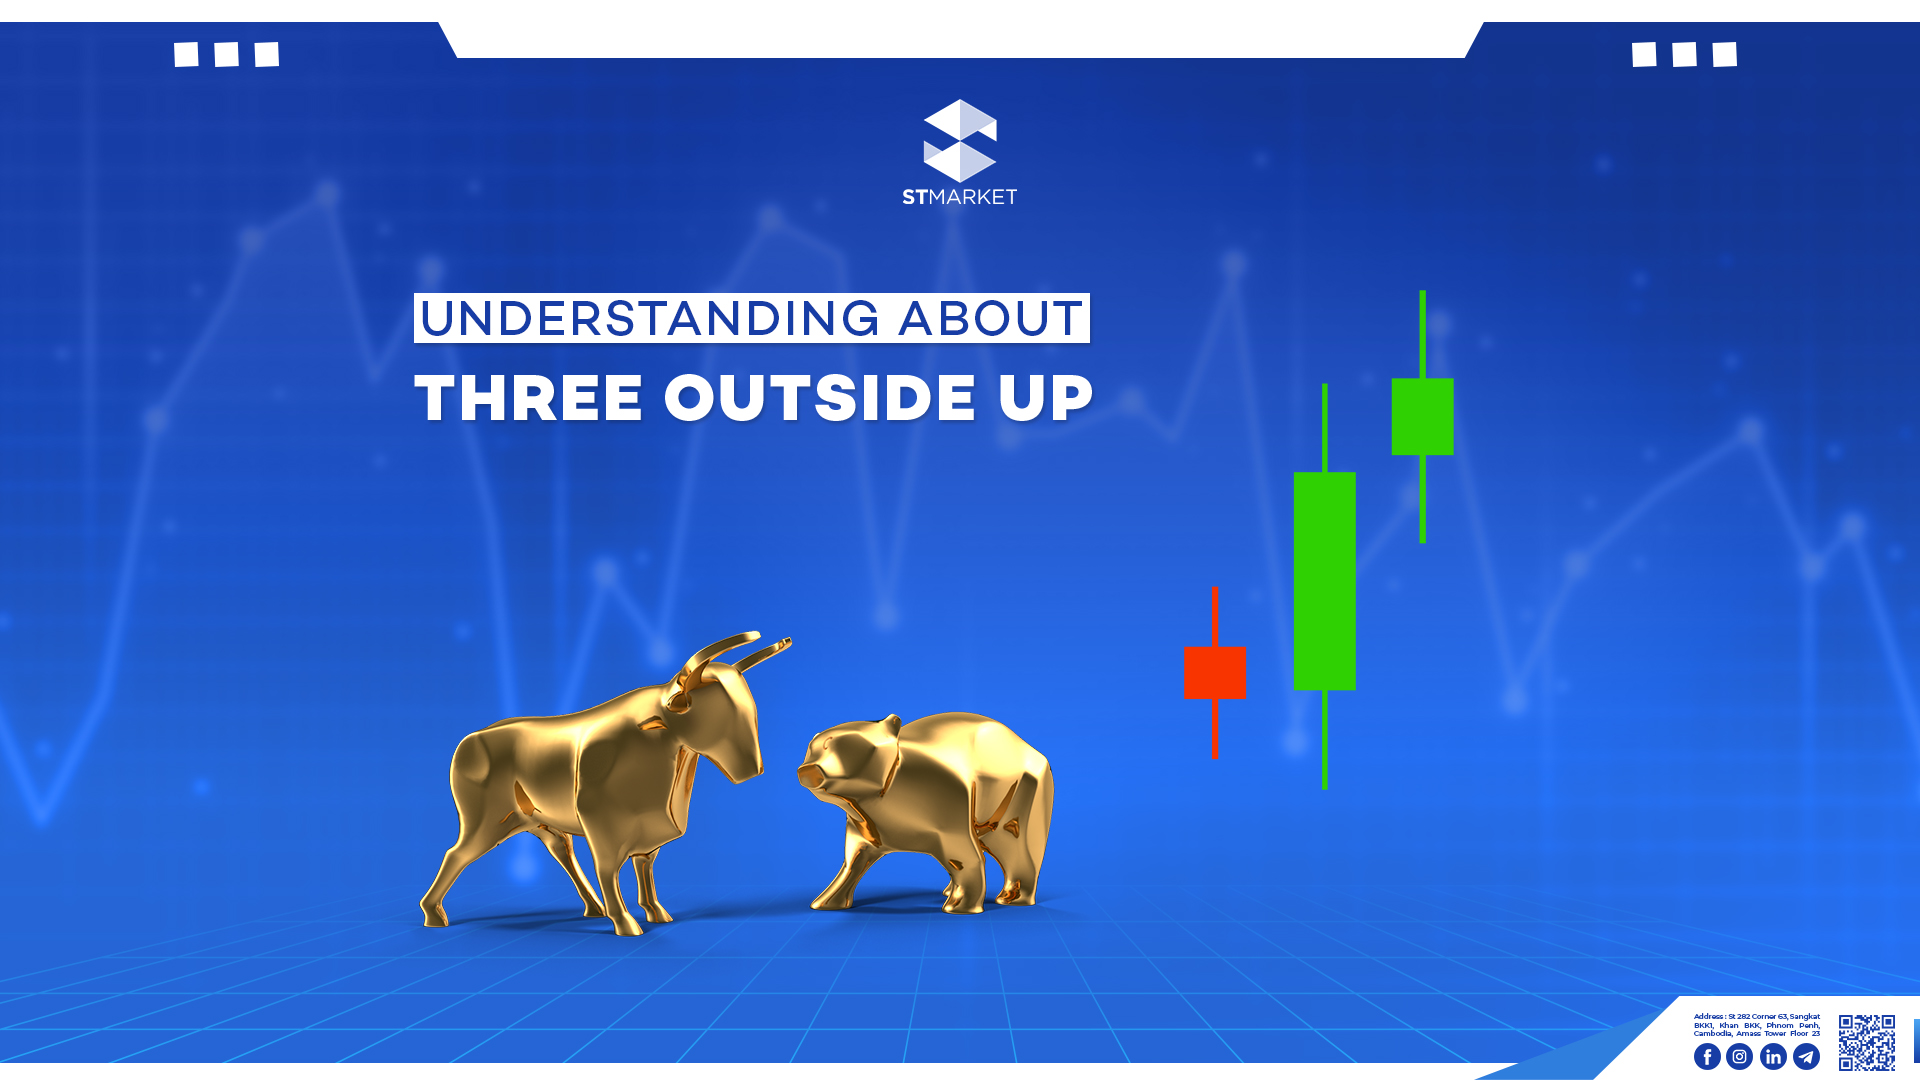
Understanding Three Outside Up Candlestick Patterns
តើអ្វីទៅជា Three Outside Up Candlestick Pattern? និយមន័យ Three Outside Up ជាទម្រង់ទានឡើងដែលផ្តល់សញ្ញាប្រាប់យើងថានឹងមានឱកាសវិលត្រឡប់នៅក្នុងលំហូរចុះ ហើយប្រាប់យើងថាកម្លាំងអ្នកទិញកំពុងមានការកើនឡើង។ វាតែងតែកើតឡើងក្នុងលក្ខណៈទាន៣នៅលើក្រាហ្វ។ រូបរាង លក្ខណៈសម្គាល់ ឩទាហរណ៍ Three Outside Up គឺជាសូចនាករមួយដែលប្រាប់យើងថាអាចនឹងមានការវិលត្រឡប់ឡើងវិញ។ វាផ្តល់សញ្ញាប្រាប់ថាចំនួនអ្នកទិញមានចំនួនច្រើនជាងចំនួនអ្នកលក់ ហើយទីផ្សារទំនងជាត្រៀមខ្លួនសម្រាប់ចលនាកើនឡើងដ័រឹងមាំមួយ។ ទម្រង់ទានបែបនេះតែងតែកើតឡើងនៅខាងចុងបញ្ចប់នៃលំហូរចុះ ហើយចង្អុលបង្ហាញថានឹងមានការប្តូរទិសដៅនៅក្នុងទីផ្សារ។យោងតាមការសិក្សាមួយធ្វើឡើងដោយលោក Cheol-Ho Park និង លោកScott H. Irwin ក្រោមប្រធានបទ “The Profitability of Technical Analysis: A Review,” បានរកឃើញថាទម្រង់ Three Outside Up មានឱកាសជោគជ័យរហូតដល់ ៧០ភាគរយក្នុងការព្យាករណ៍ពីការប្តូរទិសមកជាទិសដៅឡើងវិញ។ English Version What is Three Outside Up candlestick Pattern? Definition The Three Outside Up is a bullish candlestick pattern that signals a potential reversal in a downtrend and indicates growing buyer strength. It typically forms over three consecutive candlesticks on a price chart. Appearance Characteristics Example The Three Outside Up pattern is a dependable indicator of a possible bullish reversal. It signifies that bearish momentum has been overcome, and the market is positioned for a sustained upward movement. This pattern frequently appears at the end of a downtrend, indicating a potential shift in market direction. A study by Cheol-Ho Park and Scott H. Irwin, titled “The Profitability of Technical Analysis: A Review,” found that the Three Outside Up pattern has an approximate 70% success rate in forecasting bullish reversals.
Understanding Three Outside Down Candlestick Patterns
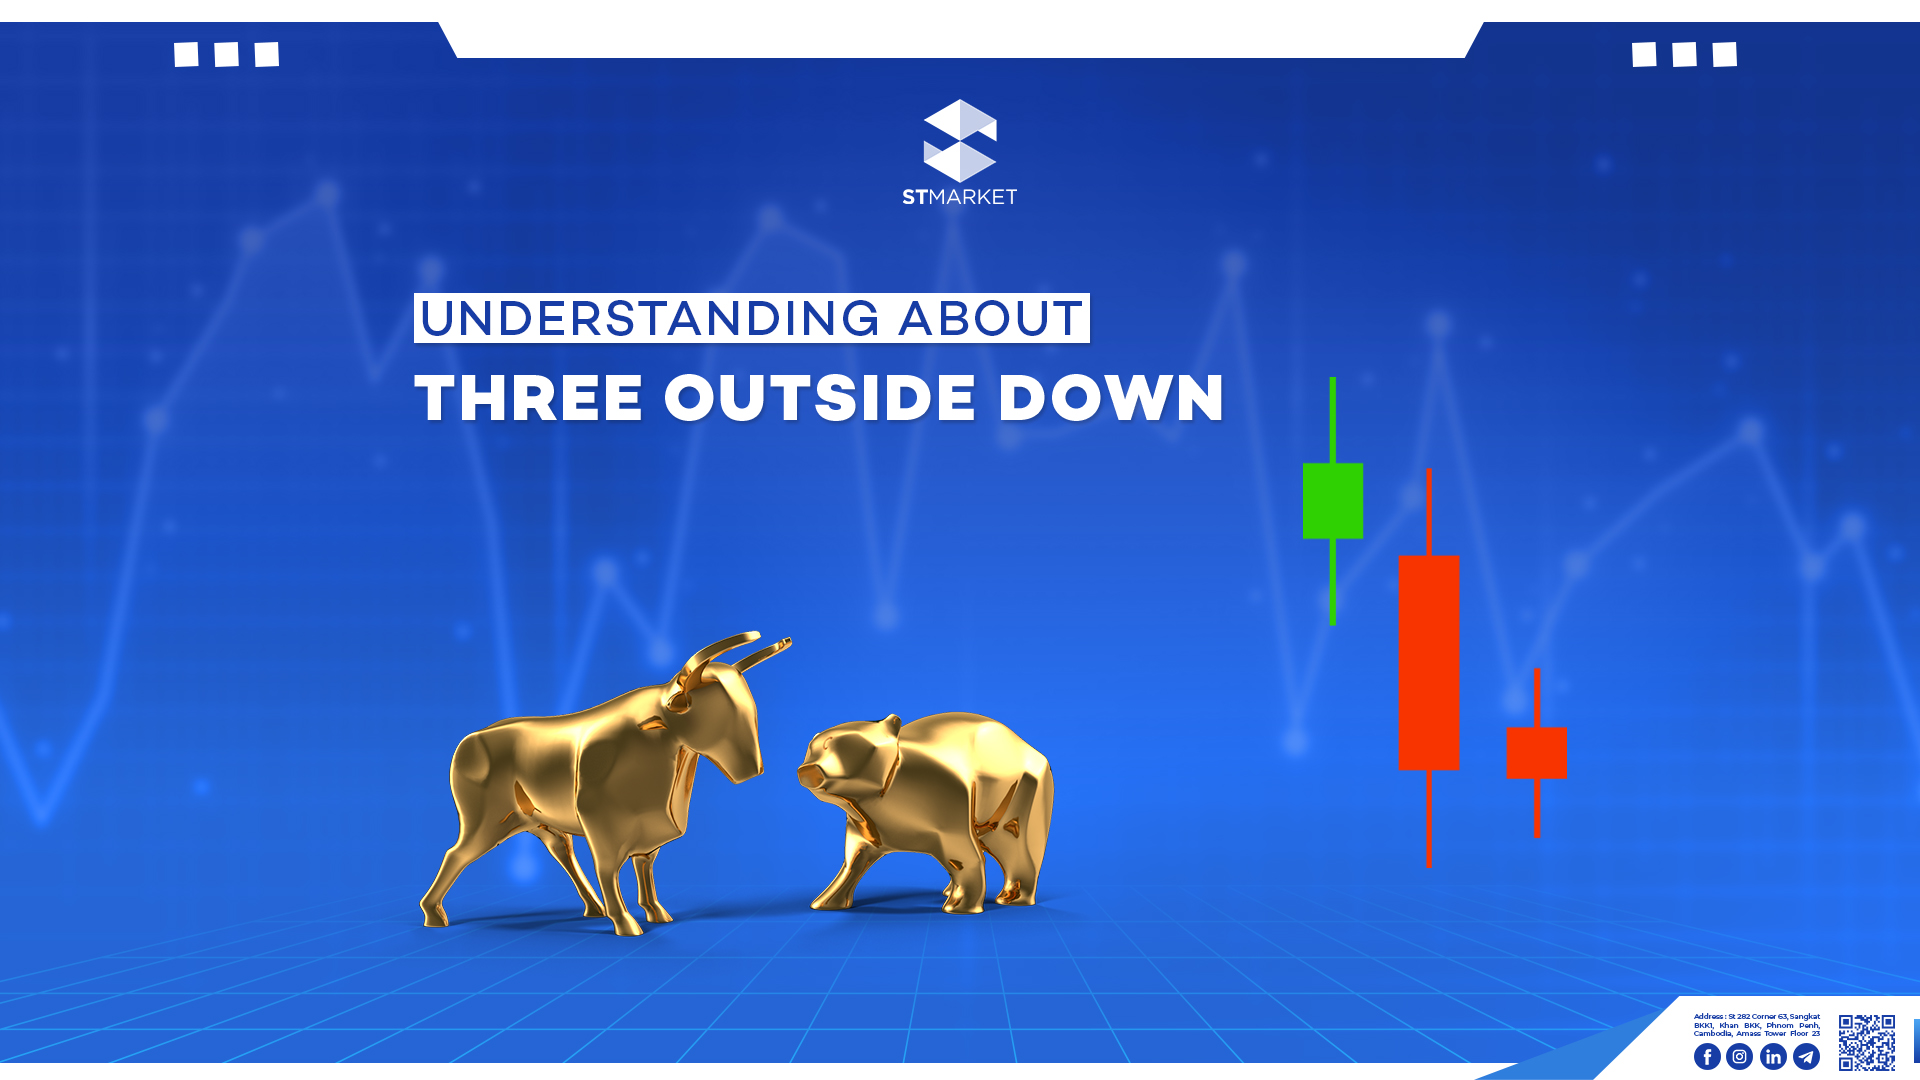
តើអ្វីទៅជា Three Outside Down Candlestick Pattern? និយមន័យDefinition Three Outside Down ជាទម្រង់ទានចុះដែលផ្តល់សញ្ញាប្រាប់យើងថានឹងមានឱកាសវិលត្រឡប់នៅក្នុងលំហូរឡើង ហើយប្រាប់យើងថាកម្លាំងអ្នកលក់កំពុងមានការកើនឡើង។ វាតែងតែកើតឡើងក្នុងលក្ខណៈទាន៣នៅលើក្រាហ្វ។ រូបរាងAppearance លក្ខណៈសម្គាល់Features ឩទាហរណ៍Example ទម្រង់ទានThree-Outside-Down កើតឡើងនៅពេលដែលទីផ្សារកំពុងមានការកើនឡើងបន្ទាប់មកក៏មានការផ្លាស់ប្តូទិសដៅព្រោះតែមានការកើនឡើងសម្ពាធអ្នកលក់ចូលមកក្នុងទីផ្សារ។ ទានដំបូងជាទានខៀវដែលបង្ហាញពីលំហូរកំពុងឡើង ហើយទានបន្តបន្ទាប់ប្រាប់ថាអ្នកទិញអស់កម្លាំងហើយអ្នកលក់ចូលមកគ្រប់គ្រងទីផ្សារដែលប្រាប់យើងថាអាចនឹងមានការប្តូទិសដៅ។ ការសិក្សារមួយធ្វើឡើងនៅដេប៉ាតេម៉ងហិរញ្ញវត្ថុ នៅសកលវិទ្យាល័យ Illinois បានដាក់ផ្សាយក្រោមប្រធានបទ “Candlestick Patterns and Market Reversals: Empirical Evidence ” បានបង្ហាញថា Three-Outside-Down មានអត្រាជោគជ័យ67%ក្នុងការព្យាករណ៍ថានឹងមានការប្តូរទិសពីឡើងមកចុះវិញ។ English Version What is Three Outside Down candlestick Pattern? Definition The Three Outside Down is a bearish candlestick pattern that indicates a potential reversal in an uptrend, signaling increasing selling pressure. Appearance Characteristics Example The three-outside-down pattern occurs when the market is rising and then abruptly changes direction because of rising selling pressure. The initial bullish candle signifies the ongoing uptrend, while the following second and third candles show that the bulls are losing their grip on the market, allowing the bears to dominate, which suggests a possible reversal. A study from the Department of Finance at the University of Illinois, featured in a research paper named “Candlestick Patterns and Market Reversals: Empirical Evidence,” indicates that the Three-Outside-Down pattern has a success rate of around 67% for forecasting bearish reversals.
Trump’s Tariff Threats: Mexico & Canada Push Back
ទោះបីជាលោកប្រធានាធិបតី Donald Trump មានគោលបំណងបង្កើនការវិនិយោគបរទេស និងកសាងផលិតផលក្នុងស្រុកនៅក្នុងសហរដ្ឋអាមេរិកតាមរយៈការគំរាមកំហែងពន្ធក៏ដោយ ក៏ដៃគូពាណិជ្ជកម្មសំខាន់ៗនៅតែមិនពេញចិត្តទៅលើគោលនយោបាយថ្មីមួយនេះដែរ។ ខាងក្រោមគឺជាអ្វីដែលលោកអ្នកគួរឈ្វេងយល់៖ → ប៉ុន្តែអ្វីដែលគួរកត់សម្គាល់នោះគឺថា ប្រទេសកាណាដាអាចនឹងប្រឈមមុខនឹងសេណារីយ៉ូនៃការជាប់គាំងរួចហើយ ដែលសង្រ្គាមពាណិជ្ជកម្មនឹងបង្កើនលទ្ធភាពនៃការកើតមានបន្តទៀត។ សូម្បីតែលោក Douglas Porter ប្រធានសេដ្ឋវិទូនៅ BMO Capital Markets ក៏បានលើកឡើងដែរថា “កាណាដាអាចនឹងប្រឈមនឹងវិបត្តិសេដ្ឋកិច្ចកម្រិតមធ្យម ប្រសិនបើពន្ធនៅតែមាន”។ ដោយលើកឡើងថា ប្រទេសកាណាដាមិនមានជម្រើសច្រើនទេសម្រាប់ពេលនេះពោលគឺលោកអាចជ្រើសរើសផ្លាស់ទីផលិតកម្មទៅសហរដ្ឋអាមេរិក ឬស្វែងរកទីផ្សារផ្សេងទៀតដូចផែនការរបស់ម៉ិកស៊ិកដែរ។ ទោះជាយ៉ាងណាក៏ដោយ នៅតែមានក្តីសង្ឃឹមសម្រាប់ការផ្លាស់ប្តូរពន្ធនៅថ្ងៃទី 2 ខែមេសា ជាមួយប្រទេសកាណាដា និងម៉ិកស៊ិក នេះបើយោងតាមសម្តីរបស់រដ្ឋមន្ត្រីពាណិជ្ជកម្មអាមេរិក Lutnick ។ |English Version| Although President Donald Trump aims to increase foreign investment and build in domestic product in the United States through tariff threats, the major trading partners are not in the very best spot. Here is what you should know about: → But what thing to note is that Canada is already posing a threat to the stagflation scenario, which having a trade war would largely escalate even more. Even Douglas Porter, chief economist at BMO Capital Markets, also cited that “Canada faces a moderate recession if tariffs stay.” Hinting that Canada has not much choice for now. Either he chooses to move the manufacturing to the US or find another market, just like Mexico’s plan. However, there is still hope for tariff changes on April 2nd with Canada and Mexico, as per US Commerce Secretary Lutnick.