Employment Report Alerts Tonight at 8:30PM (GMT+7) ទិន្នន័យការងាររបស់សហរដ្ឋអាមេរិកនឹងត្រូវបានចេញផ្សាយនៅយប់នេះវេលាម៉ោង 8:30 យប់ (GMT+7) ដោយវិនិយោគិនភាគច្រើនបានព្យាករណ៍ទិន្នន័យដែលមានទស្សនវិស័យខុសៗគ្នា។ ខាងក្រោមនេះជាព័ត៌មានដែលអ្នកគួរដឹង៖ ទោះបីជាយ៉ាងនេះក៏ដោយ វាមិនតែងតែមានន័យថាតម្លៃមាសកើនឡើងនោះទេ។ ពោលគឺ មានកត្តាផ្សេងទៀតដែលត្រូវពិចារណាដូចជាសុន្ទរកថារបស់សមាជិកធនាគារកណ្តាល (Powell, Bowman, William) កិច្ចប្រជុំកំពូលរបស់ Trump រួមជាមួយនឹងព្រឹត្តិការណ៍ភូមិសាស្ត្រនយោបាយផ្សេងៗទៀត។ |English Version| US Labor data will be released tonight at 8:30 PM (GMT+7) with a mixed projection between each data. Here are things you should be aware of: 1. Worse Sentiment: recent uncertainty in policy changes, either trade conflict, federal budget cutting, or new government policies are taking a toll on demand, consumption, and business activities, while inflation is flaring around; all of these are showing signs of being reluctant in hiring activities. 2. not only the sentiment of uncertainty ahead, the recent downsizing workforce is likely to diminish the strength of labor market conditions. 3. Purchasing managers’ index reports from ISM, S&P, and ADP employment changes are making sure that we know about softening in the employment level. Despite this, that does not always set a 100% path for upward GOLD prices. There are other factors to consider, such as the Federal Reserve member speech (Powell, Bowman, and William), Trump’s summit, and other geopolitical events.
Trump Administration Cites Fentanyl Progress as Key to Further Tariff Reduction ទោះបីជាប្រធានាធិបតីលោក Trump មិនព្រមធ្វើការផ្លាស់ប្តូរគោលនយោបាយដំឡើងពន្ធលើដែកថែប និងអាលុយមីញ៉ូមនៅសប្តាហ៍ក្រោយក៏ដោយ លោកប្រធានាធិបតី Trump បានផ្តល់ការលើកលែងពន្ធបណ្តោះអាសន្នលើទំនិញនាំចេញមួយចំនួនពីប្រទេសកាណាដា និងម៉ិកស៊ិក ដែលធ្លាក់ក្នុងលក្ខខណ្ឌកិច្ចព្រមព្រៀងរបស់ USMCA រហូតដល់ថ្ងៃទី 2 ខែមេសា។ កិច្ចព្រមព្រៀងបណ្ដោះអាសន្ននេះបានលុបចោលផ្នែកខ្លះនៃពន្ធគយ 25% ដែលបានដាក់កាលពីពេលថ្មីៗនេះ ដែលនាំឱ្យមានភាពមិនច្បាស់លាស់ទូទាំងសកលលោក។ យោងតាមសេតវិមាន 50% នៃការនាំចូលរបស់ម៉ិកស៊ិកនិង 38% នៃការនាំចូលកាណាដាគឺស្ថិតនៅក្រោមគោលការណ៍ USMCA ហើយដរាបណា fentanyl ដំណើរការល្អ(ត្រូវបានកាត់បន្ថយតាមពេលកំណត់) ពន្ធគយរបស់សហរដ្ឋអាមេរិកក៏អាចនឹងមានភាគរយច្រើនលុបបំបាត់នោះដែរ។ ជាការឆ្លើយតប កាណាដាក៏បានពន្យារពេលការដំឡើងពន្ធទីពីរលើទំនិញអាមេរិកតម្លៃ 125 ពាន់លានដុល្លាររហូតដល់ថ្ងៃទី 2 ខែមេសា។ ការកាត់បន្ថយថ្លៃដើម៖ Trump និង Elon Musk ឥឡូវនេះកំពុងបន្តធ្វើការលើការកាត់បន្ថយការចំណាយ និងបុគ្គលិកនៅ DOGE ហើយជាមួយនឹងការបញ្ឈប់ការងារជាបន្តបន្ទាប់ ទាំងអស់នេះអាចនាំឱ្យមានអត្រាគ្មានការងារធ្វើខ្ពស់នៅចន្លោះខែកុម្ភៈ និងខែមីនា។ Strategic Bitcoin Reserve៖ លោក Trump បានចុះហត្ថលេខាជាផ្លូវការនូវបទបញ្ជាប្រតិបត្តិមួយ និង “ដឹកនាំរដ្ឋាភិបាលឱ្យស្តុកទុក bitcoin, ethereum និងសញ្ញាសម្ងាត់បីផ្សេងទៀត” នេះបើយោងតាមប្រភព CNN ។ ព័ត៌មានផ្សេងទៀត៖ ការពន្យាពេលកំណត់ Tiktok, កិច្ចព្រមព្រៀងវិនិយោគដ៏ធំមួយរវាង Trump និង Saudi Arabia, ព្រមទាំងសេចក្តីថ្លែងការណ៍មួយទាក់ទងនឹងការការពារពីសហរដ្ឋអាមេរិកមកលើជប៉ុន។ |English Version| Despite not altering tariff policy on steel and aluminum, saying that this will happen next week, President Trump has granted temporary tariff exemptions on some exported goods from Canada and Mexico that meet USMCA requirements until April 2nd. This temporary agreement partially undoes the recently imposed 25% tariffs, which has led to global uncertainty. According to the White House, 50% of Mexican and 38% of Canadian imports comply with USMCA and as long as fentanyl progresses well, the US tariff is also likely to drop in response as well. In response, Canada has also postponed a second set of tariffs on $125 billion worth of US goods until April 2nd. Cost cutting: Trump and Elon Musk are now continuing to work on reducing the cost measuring and staffing on DOGE, and with ongoing layoffs, all of these could potentially lead to a higher unemployment rate in between February and March. Strategic Bitcoin Reserve: Trump officially signed an executive order and “direct the government to stockpile bitcoin, ethereum, and three other tokens,” as per CNN sources. Other news: an extension of the Tiktok deadline, working on a large investment agreement between Trump and Saudi Arabia, a statement regarding US-Japan relations.

Top News of the Day: A Quick Recap លោកប្រធានាធិបតី Donald Trump៖ ធនាគារកណ្តាលប្រទេសអង់គ្លេស ឥឡូវនេះពួកគេមានក្តីបារម្ភកាន់តែខ្លាំងទៅលើការជាប់គាំងអត្រាអតិផរនា ដែលអាចបណ្តាលមកពីការកើនឡើងធានារ៉ាប់រងជាតិដែលបង្ខំឱ្យមានការដំឡើងថ្លៃឈ្នួលចំនួន 2% ។ ពោលគឺវាបានបន្តដំឡើងអតិផរណាក្នុងចន្លោះ 0.1-0.2% នេះបើយោងតាមសមាជិកធនាគារកណ្តាលអង់គ្លេសលោក Bailey ។ ខណៈពេលដែលអ្នកផ្សេងទៀតជឿថាឥទ្ធិពលជុំទី 2 នៃអតិផរណាអាចនឹងមានភាគរយតិចក្នុងកើតឡើង ដោយសារតែភាពទន់ខ្សោយនៅក្នុងកំណើនសេដ្ឋកិច្ច។ ការងារនៅសហរដ្ឋអាមេរិក ការផ្លាស់ប្តូរការងាររបស់ ADP បានធ្លាក់ចុះទាបជាងតួលេខដែលបានប៉ាន់ប្រមាណដោយសារតែការបញ្ឈប់ការងារថ្មីៗពីគោលនយោបាយរបស់លោក Trump និងភាពមិនច្បាស់លាស់នៅក្នុងទស្សនវិស័យសេដ្ឋកិច្ច។ ខណៈពេលដែលមានការធ្លាក់ចុះនៃសកម្មភាព និងការបញ្ជាទិញថ្មីដែលនាំឱ្យអាជីវកម្មមួយចំនួនស្ទាក់ស្ទើរក្នុងការជ្រើសរើសបុគ្គលិកបន្ថែមទៀត។ |English Version| President Donald Trump: The Bank of England: Job in the United States ADP employment changes dropped below the estimated figure due to recent layoffs from Trump’s policy and uncertainty in the economic outlook. While there are some drawbacks in activities and new orders that lead the business to reluctantly replace leavers.
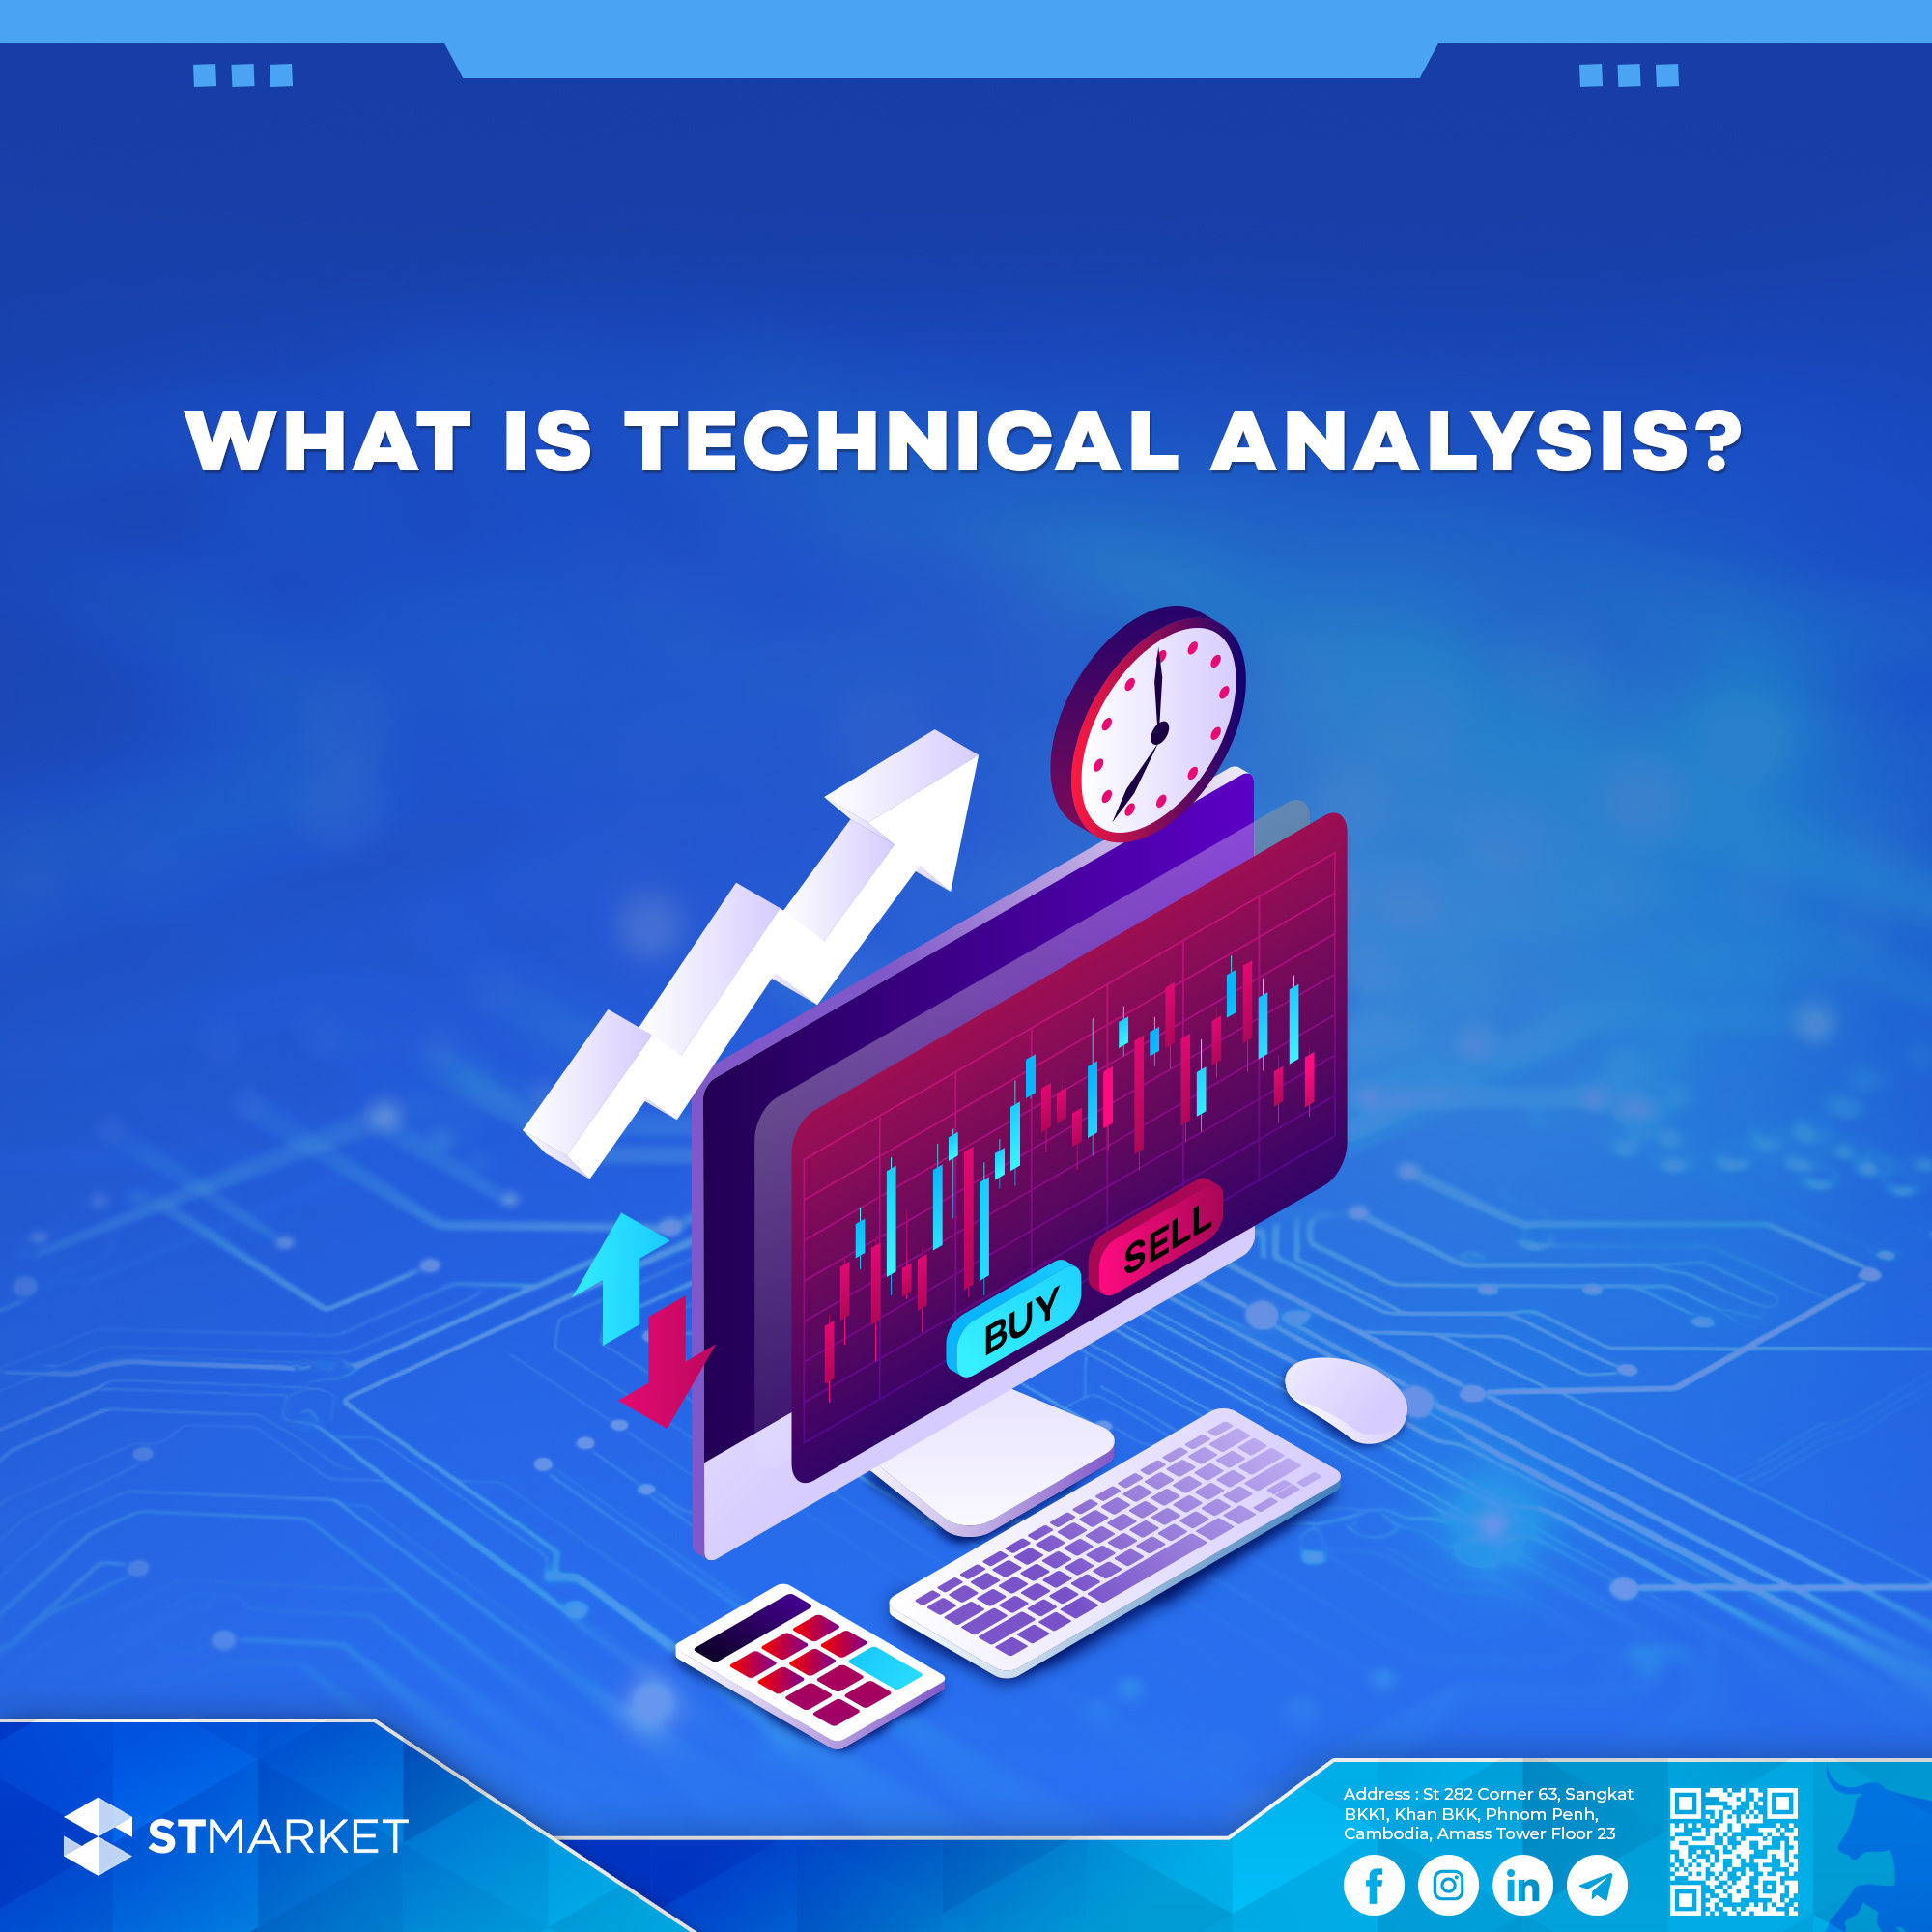
What is technical analysis ?
What is technical analysis ? ⭐️ គន្លឹះសំខាន់ – ការវិភាគបែបបច្ចេកទេស គឺជាការសិក្សាអំពីតម្លៃដែលទ្រព្យមួយប្រភេទធ្លាប់ឡើងឬចុះទៅដល់ ដើម្បីកំណត់លំនាំ និងលទ្ធភាពនៃចលនារបស់ទ្រព្យថាវាអាចឡើងឬចុះដល់កម្រិតណានាពេលអនាគត ដោយប្រើប្រាស់សូចនាករបច្ចេកទេសនិងលំនាំតារាង។ – គោលដៅបំណងសំខាន់ៗបីនៃការវិភាគបច្ចេកទេស។ – ឧបករណ៍ជំនួយ និងបច្ចេកទេសដែលលោកអ្នកគួរប្រើក្នុងការវិភាគបែបបច្ចេកទេស – ឯកសារយោង ⭐️ ស្វែងយល់ពីការវិភាគបែបបច្ចេកទេស ការវិភាគបែបបច្ចេកទេស គឺជាការសិក្សាអំពីតម្លៃដែលទ្រព្យមួយប្រភេទធ្លាប់ឡើងឬចុះទៅដល់ ដើម្បីកំណត់លំនាំ និងលទ្ធភាពនៃចលនារបស់ទ្រព្យថាវាអាចឡើងឬចុះដល់កម្រិតណានាពេលអនាគត ដោយប្រើប្រាស់សូចនាករបច្ចេកទេសនិងលំនាំតារាង។ ការវិភាគបែបបច្ចេកទេសមិនមែនសម្រាប់វាស់ស្ទង់តម្លៃពិតប្រាកដរបស់ទ្រព្យសកម្មទេ ការវិភាគបែបនេះ តម្រូវឲ្យយើងមើលពីតម្លៃដែលទ្រព្យមួយប្រភេទធ្លាប់ឡើងឬចុះទៅដល់ និងរកចំណុចដែលយើងអាចចូលឬចេញពីទីផ្សារបាន ដោយប្រើសូចនាករបច្ចេកទេសផ្សេងៗ។ ភាពខុសគ្នាចម្បងរវាងការវិភាគបែបបច្ចេកទេស និងការវិភាគបែបមូលដ្ឋាន គឺការវិភាគបែបបច្ចេកទេសប្រើតែទិន្នន័យតម្លៃប្រវត្តិសាស្ត្ររបស់ទ្រព្យ និងទំហំនៃការជួញដូរឧបករណ៍និស្សន្ទតែប៉ុណ្ណោះ។ ⭐️ គោលដៅបំណងសំខាន់ៗបីនៃការវិភាគបច្ចេកទេស អ្នកវិនិយោគដែលប្រើការវិភាគបែបបច្ចេកទេសតែងតែមានគោលដៅ ៣ សំខាន់ៗ គឺ ⭐️ឧបករណ៍ជំនួយ និងបច្ចេកទេសដែលលោកអ្នកគួរប្រើក្នុងការវិភាគបែបបច្ចេកទេស ទីផ្សារអាចធ្វើចលនាតែ៣ទិសតែប៉ុណ្ណោះគឺ ផ្សារអាចឡើង ផ្សារអាចចុះ ឬផ្សារអាចដើរចំហៀង ( Move sideways) ដូចនេះការវិភាគតាមបែបបច្ចេកទេសតម្រូវឲ្យយើងស្វែងរកនិន្នាការនៃផ្សារ ព្រមទាំងស្វែងរក support/resistance តាមរយៈការប្រើប្រាស់តារាងតម្លៃនិង/ឬតារាងពេលវេលា (Timeframe )។ ជាទូទៅតម្លៃតែងតែផ្លាស់ប្តូរក្នុងរបៀបហ្ស៊ីកហ្សាក់ ( Zigzag) ហើយសកម្មភាពតម្លៃមានពីរគឺ ៖ ជាទូទៅ អ្នកដែលវិភាគតាមការវិភាគបែបបច្ចេកទេសតែងតែប្រើប្រាស់ធាតុសំខាន់ៗ៣ គឺ ៖ ⭐️ឯកសារយោង Babypip: What is Technical Analysis? – BabyPips.com Investopedia: Technical Analysis: What It Is and How to Use It in Investing (investopedia.com) ⏬English Below⏬ ⭐️ Key takeaway – Technical analysis is a method of analyzing the historical price action of an asset to determine the pattern and probability that an asset may move up or down in the future.– The three main objectives of Technical analysis– Tools and techniques used in Technical analysis– References ⭐️Understanding Technical analysis Technical analysis is a method of analyzing the historical price action of an asset to determine the pattern and probability that an asset may move up or down in the future. Technical analysis uses technical indicators and chart patterns to identify buy and sell entries in the market. It is important to note that technical analysis is not intended to measure the value of an asset, but rather to identify patterns and trends that can help traders make informed decisions. The main difference between technical analysis and fundamental analysis is that technical analysis uses only historical price data of assets and the volume of trading. ⭐️The three main objectives of Technical analysis Investors who use technical analysis always have three main objectives: ⭐️Tools and techniques used in Technical analysis The market can only move in three directions: up, down, or sideways. Technical analysis requires finding the market trend and support/resistance through the use of charts, values, and/or timeframes. In general, prices change in a zigzag mode with two price actions: In general, technical analysts often use three main elements: ⭐️ References Babypip: What is Technical Analysis? – BabyPips.com Investopedia: Technical Analysis: What It Is and How to Use It in Investing (investopedia.com)
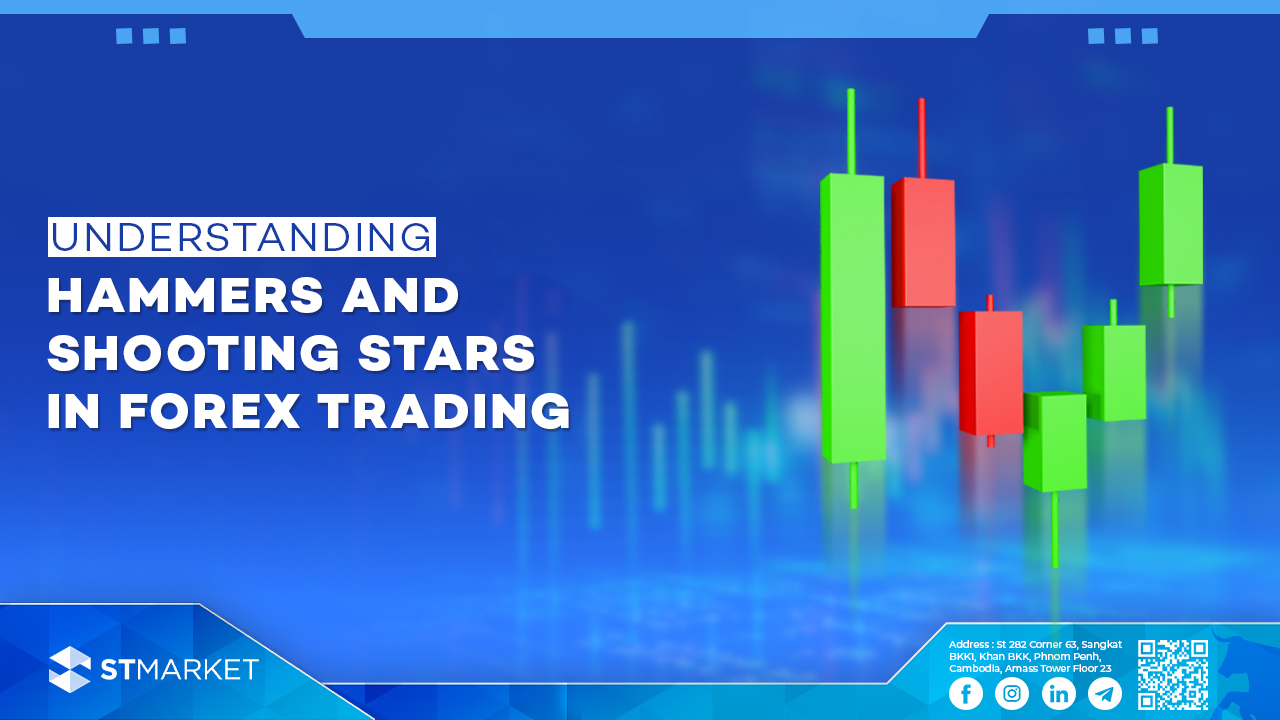
Understanding Hammers and Shooting Stars in Forex Trading
Understanding Hammers and Shooting Stars in Forex Trading នៅក្នុងវិស័យរូបិយប័ណ្ណអន្តរជាតិ ការឈ្វេងយល់ពីប្រភេទនៃ Candle Stick អាចនឹងជួយលោកអ្នកក្នុងការព្យាករណ៍ទៅលើបម្រែបម្រួលទីផ្សារ ព្រមទាំងធ្វើឱ្យការសម្រេចចិត្តជួញដូរកាន់តែប្រសើរជាងមុន។ ប្រភេទនៃ Candle Stick ដែលពេញនិយមជាងគេគឺ Hammer និង Shooting Star។ នៅក្នុងអត្ថបទខាងក្រោមនេះ លោកអ្នកនឹងឈ្វេងយល់ពីប្រភេទនៃ Candle Stick របៀបកំណត់អត្តសញ្ញាណ និងរបៀបប្រើប្រាស់វាឱ្យមានប្រសិទ្ធភាពក្នុងយុទ្ធសាស្រ្តជួញដូររបស់អ្នក។ តើអ្វីទៅជា Hammer? និយមន័យ Hammer គឺជាប្រភេទនៃ Candle Stick ដែលបង្ហាញពីសញ្ញានៃការវិលត្រឡប់ទៅលំហូរឡើង ពោលគឺការផ្លាស់ប្តូរពីលំហូរចុះទៅលំហូរឡើង។ វាបានផ្តល់នូវសញ្ញាថា អាចនឹងមានលទ្ធភាពដែលតម្លៃអាចនឹងចាប់ផ្តើមកើនឡើង។ រូបរាង លក្ខណៈសម្គាល់ នៅក្នុងលំហូរចុះ ប្រភេទ Hammer គឺចាប់ផ្តើមបង្កើតឡើងនៅពេលដែលតម្លៃព្យាយាមរុញចុះទៅក្រោមបន្តទៀត ប៉ុន្តែគួបផ្សំជាមួយនឹងចំនួនអ្នកទិញកាន់តែច្រើនដែលធ្វើឱ្យតម្លៃកើនឡើង។ ទាំងនេះបានបង្កើតជាទម្រង់ Hammer ដែលបង្ហាញថាចំនួនអ្នកទិញមានច្រើននៅក្នុងទីផ្សារ ហើយបម្រែបម្រួលអាចនឹងកើតមាន។ ការកំណត់អត្តសញ្ញាណ Hammer ឧទាហរណ៍ Hammer ចាប់ផ្តើមលេចឡើងបន្ទាប់ពីមានការធ្លាក់ចុះ ដែលបង្ហាញពីសញ្ញាបញ្ច្រាសនិន្នាការឬលទ្ធភាពដែលអាចមានបម្លាស់ប្តូរទិសដៅឡើងទៅលើ។ តើអ្វីទៅជា Shooting Star? និយមន័យ Shooting Star គឺជាប្រភេទនៃ Candle Stick ដែលបង្ហាញពីសញ្ញានៃការវិលត្រឡប់ទៅលំហូរចុះ ពោលគឺការផ្លាស់ប្តូរពីលំហូរឡើងទៅលំហូរចុះ។ វាបានផ្តល់នូវសញ្ញាថា អាចនឹងមានលទ្ធភាពដែលតម្លៃអាចនឹងចាប់ផ្តើមធ្លាក់ចុះ។ រូបរាង លក្ខណៈសម្គាល់ ក្នុងទិសដៅកើនឡើង Shooting Star បានបង្កើតឡើងនៅពេលដែលតម្លៃព្យាយាមឡើងខ្ពស់ ប៉ុន្តែជាមួយនឹងចំនួនអ្នកទិញច្រើនដែលអាចធ្វើឱ្យតម្លៃបានធ្លាក់ចុះ នោះShooting Star ត្រូវបានបង្កើតឡើង។ ទាំងនេះបានសបញ្ជាក់ថា ចំនួនអ្នកទិញមានច្រើន ហើយការផ្លាស់ប្តូរទិសអាចនឹងកើតមានឡើង។ កំណត់អត្តសញ្ញាណ Shooting Star ឧទាហរណ៍ Shooting Star បានលេចចេញឡើងបន្ទាប់ពីមាននិន្នាការកើនឡើង បង្កើតឱ្យមានបម្រែបម្រួលខ្ពស់ដោយសារតែមានសញ្ញានៃការផ្លាស់ប្តូរទិសទៅក្រោម។ ការគ្រប់គ្រងហានិភ័យ ធ្វើការវិភាគទៅលើការសម្រេចចិត្តការជួញដូររបស់លោកអ្នកដោយប្រុងប្រយ័ត្ន ដោយប្រើប្រាស់ទៅលើទំហំលើការជួញដូរ ព្រមទាំងកំណត់នៅតំបន់ Stop-loss ដើម្បីការពារទៅលើប្រាក់ទុនរបស់លោកអ្នក។ សេចក្តីសន្និដ្ឋាន ការឈ្វេងយល់ ព្រមទាំងកំណត់អត្តសញ្ញាណឱ្យបានត្រឹមត្រូវទៅលើប្រភេទ Hammer និង Shooting Star អាចនឹងបង្កើនភាពជោគជ័យទៅលើយុទ្ធសាស្រ្តជួញដូររបស់អ្នកយ៉ាងខ្លាំង។ គំរូទាំងនេះផ្តល់នូវការយល់ដឹងដ៏មានតម្លៃចំពោះការផ្លាស់ប្តូរទិសដៅនៅក្នុងទីផ្សារ ប៉ុន្តែពួកគេក៏គប្បីប្រើប្រាស់ជាមួយនឹងសូចនាករផ្សេងទៀត និងវិធីសាស្រ្តក្នុងការកំណត់ហានិភ័យនោះដែរ។ (English Version) In the dynamic world of Forex trading, understanding candlestick patterns can significantly enhance your ability to predict market movements and make more accurate trading decisions. Two of the most reliable reversal patterns are the hammer and the shooting star. In this blog post, we will explore what these patterns are, how to identify them, and how to use them effectively in your trading strategy. What is a Hammer? Definition A hammer is a bullish reversal candlestick pattern that typically forms after a downtrend. It signals that a potential bottom is forming and that the price may start to rise. Appearance Characteristics In a downtrend, a hammer forms when the price attempts to push lower but is met with strong buying pressure that drives the price back up, creating the hammer shape. This indicates that buyers are taking control of the market and a reversal may occur. Identifying a Hammer on a Chart Example A hammer appears after a downtrend, signaling a potential trend reversal. Appearance What is a Shooting Star? Definition A shooting star is a bearish reversal candlestick pattern that typically forms after an uptrend. It signals that a potential top is forming and that the price may start to fall. Appearance Characteristics In an uptrend, a shooting star forms when the price tries to push higher but is met with strong selling pressure that drives the price back down, creating the shooting star shape. This indicates that sellers are taking control of the market and a reversal may occur. Identifying a Shooting Star on a Chart Example A shooting star appears after an uptrend, increasing its significance as a bearish reversal signal. Appearance Risk Management Assess your trading decisions carefully. Use appropriate position sizing and manage trades using stop-loss orders to protect your capital. Conclusion Understanding and correctly identifying hammer and shooting star patterns can greatly enhance your trading strategy. These patterns provide valuable insights into potential market reversals, but they should be used in conjunction with other technical indicators and risk management practices.
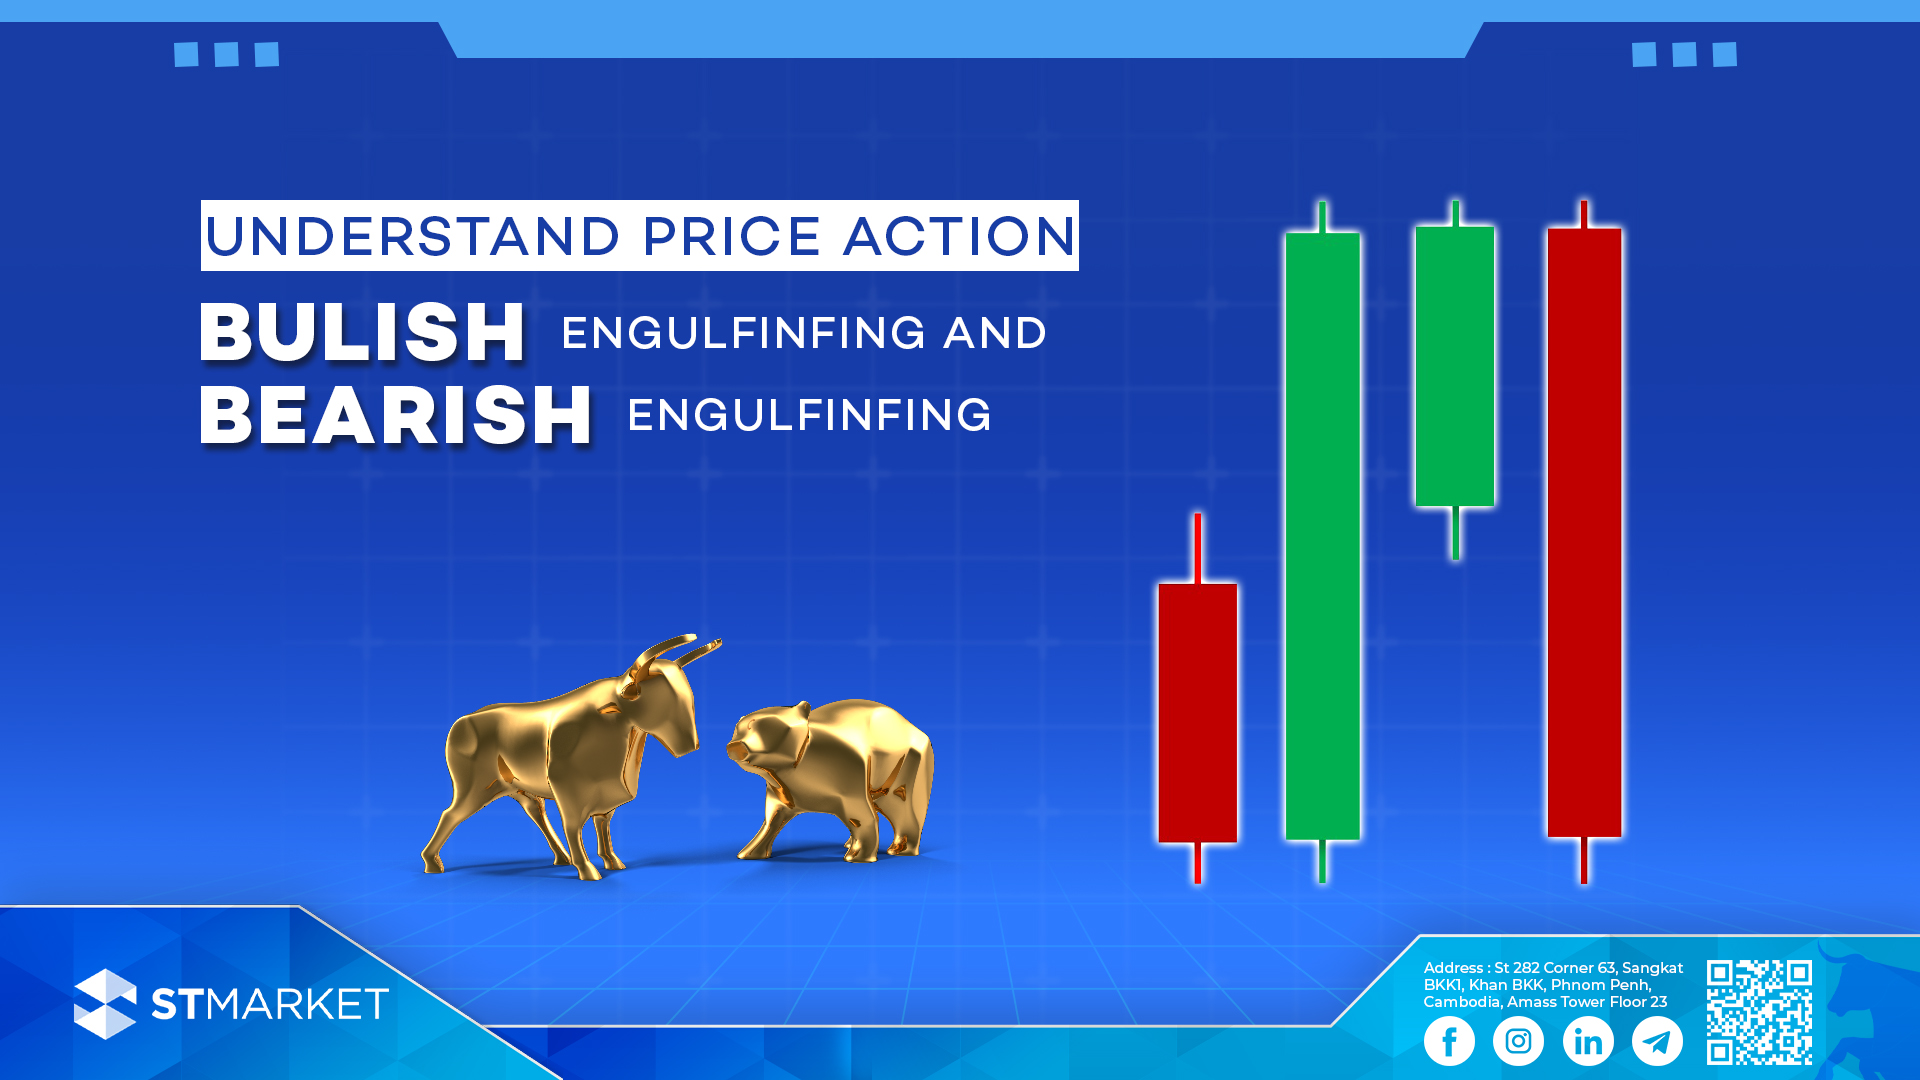
Bullish Engulfing and Bearish Engulfing
Bullish Engulfing and Bearish Engulfing អ្វីទៅជា Bullish Engulfing? និយមន័យ ទម្រង់ Bullish Engulfing គឺជាសញ្ញានៃការប្តូរទិសពីលំហូរចុះមកឡើងវិញ ដែលភាគច្រើនវាបង្ហាញនៅចុងនៃលំហូរចុះ។ រូបរាង លក្ខណៈសម្គាល់ គំរូ Bullish Engulfingមាន២ខេនដល ដែលខេនដលទីមួយពណ៌ក្រហម(តម្លៃបិទទាបជាងតម្លៃបើកផ្សារ) និង ខេនដលទី២ ពណ៌បៃតង(តម្លៃបិទផ្សារខ្ពស់ជាងតម្លៃបើកផ្សារ) ដែលខេនដលទី២ក្តោមពីលើខេនដលទី១ វាបង្ហាញថាអ្នកទិញចូលមកគ្រប់គ្រងនៅក្នុងទីផ្សារ។ នៅក្នុងលំហូរចុះតម្លៃព្យាយាមបុកបំបែកទៅតំបន់ដែលទាបជាងមុន ប៉ុន្តែវាបានបង្កើតជាទម្រង់ Bullish Engulfing វាជាសញ្ញានៃកាវិលត្រឡប់នៃលំហូរចុះ។ ឧទារហរណ៍ នៅខាងចុងនៃលំហូចុះ បង្កើតបានជាទម្រង់ Bullish Engulfing ទម្រង់ Bullish engulfing ត្រូវបានបង្កើតឡើងនៅពេលដែលទីផ្សារបើកមកនៅទាបជាងតម្លៃបិទកាលពីម្សិលមិញប៉ុន្តែអ្នកទិញក៏បានឃើញអ្នកទិញចូលមកក្នុងទីផ្សារហើយរុញតម្លៃអោយឡើងទៅលើ ហើយបិទនៅលើតម្លៃបើកកាលពីម្សិលមិញ។ ទម្រង់ Bullish Engulfing កំណត់ប្រាប់យើងថាមានការផ្លាស់ប្តូរ ពីសន្ទស្សន៍អារម្មណ៍របស់អ្នកលក់ទៅជាមានសន្ទស្សន្ទអារម្មណ៍អ្នកទិញចូលមកគ្រប់គ្រងទីផ្សារ ហើយវាជាពេលវេលាល្អក្នុងការរកឱកាសដើម្បីរកតម្លៃចូលទិញ។ យោងតាមការសិក្សាអំពី “Technical Analysis and Candlestick Patterns” ដែលធ្វើឡើងដោយ សកលវិទ្យាល័យនៃ Michiganនៅក្នុងឆ្នាំ 2018 ទម្រង់engulfing pattern មានអត្រាជោគជ័យប្រហែល 65% ក្នុងការព្យាករណ៍ថាតម្លៃនៅពេលខាងមុនហ្នឹងមានការកើនឡើង។ ការសិក្សានេះគូសបញ្ជាក់អំពីប្រសិទ្ធភាពនៃការប្រើប្រាស់ប្រវត្តិទិន្នន័យតម្លៃ និងទម្រង់ខេនដល ដូចជាទម្រង់ bullish engulfing ដើម្បីវាស់ស្ទង់អារម្មណ៍ទីផ្សារ និងធ្វើការសម្រេចចិត្តក្នុងការជួញដូរដែលមានប្រសិទ្ធភាពជាងមុន។ អ្វីទៅជា Bearish Engulfing? និយមន័យ គំរូ Bearish Engulfing គឺជាសញ្ញានៃការផ្លាស់ប្តូរទិសរបស់លំហូរឡើង ដែលភាគច្រើនវាបង្ហាញនៅចុងនៃលំហូរឡើង។ រូបរាង លក្ខណៈសម្គាល់ គំរូ Bearish Engulfing មាន២ខេនដល ដែល ខេនដលទីមួយពណ៌បៃតង(តម្លៃបិទផ្សារខ្ពស់ជាងតម្លៃបើកផ្សារ) និង ខេនដលទី២ពណ៌ក្រហម(តម្លៃបិទទាបជាងតម្លៃបើកផ្សារ) ដែលខេនដលទី២ក្តោមពីលើខេនដលទី១ វាបង្ហាញថាអ្នកលក់ចូលមកគ្រប់គ្រងទីផ្សារ។ នៅក្នុងលំហូរឡើង ទីផ្សារបានព្យាយាមបុកបំបែកទៅតំបន់ដែលខ្ពស់ជាងមុន ប៉ុន្តែវាបានបង្កើតជាទម្រង់ Bearish Engulfing នេះជាសញ្ញានៃកាវិលត្រឡប់នៃលំហូរ។ ឧទារហរណ៍ នៅខាងចុងនៃលំហូរឡើងវាបង្កើតបានជាទម្រង់ Bearish Engulfing ទម្រង់ Bearish Engulfing មានខេនដលពីរ៖ ទីមួយគឺជាខេនដលដែលមានសន្ទុះតូចជាង ហើយទីពីរគឺជាខេនដលដែលមានទំហំធំជាងដែលគ្រប់ដណ្តប់ពេញតួនៃទៀនទីមួយ។ ការបង្កើតនេះបង្ហាញពីការផ្លាស់ប្តូរសន្ទុះពីអ្នកទិញទៅអ្នកលក់។ យោងតាមការសិក្សាដែលធ្វើឡើងដោយ Technical Analysis Research & Education (TARE) Foundation ដែលបានបោះពុម្ពផ្សាយនៅក្នុងរបាយការណ៍របស់ពួកគេដែលមានចំណងជើងថា “Analyzing the Efficacy of Candlestick Patterns in Modern Markets,” ទម្រង់ Bearish Engulfing មានអត្រាជោគជ័យប្រហែល 72% ក្នុងការព្យាករណ៍ថាហ្នឹងមានការប្តូរទិសពីឡើងមកចុះ។ (English Version) What is the Bullish Engulfing Pattern? Definition A Bullish Engulfing pattern is a bullish reversal pattern that typically appears at the end of a downtrend. Appearance Characteristics The Bullish Engulfing pattern contains two candlesticks, the first candlestick is bearish, andthe second candlestick is bullish engulfing the first candlestick, indicating buyer take control in the market. During a downtrend, prices attempt to break into lower regions, but the formation of a Bullish Engulfing pattern signals a potential reversal. Example Look for the pattern at the end of a downtrend, where a larger bullish candle engulfs the previous bearish candle. The bullish engulfing candlestick pattern is formed when the market opens lower than the previous day’s close, but then buyers step in and push the price higher, closing above the previous day’s open. The bullish engulfing candlestick pattern marks a clear transition from bearish to bullish market sentiment and an opportunity to take long positions. According to the “Technical Analysis and Candlestick Patterns” study conducted by the University of Michigan in 2018, the bullish engulfing pattern has a success rate of approximately 65% in predicting future price increases. This study underscores the effectiveness of using historical price data and candlestick patterns, such as the bullish engulfing pattern, to gauge market sentiment and make informed trading decisions. What is the Bearish Engulfing Pattern? Definition A Bearish Engulfing pattern is a bearish reversal pattern that typically appears at the end of an uptrend. Appearance Characteristics The Bearish Engulfing pattern contains two candlestick, first candlestick is bullish and second candlestick is bearish engulfs the first candlestick indicates a shift from buyer control to seller control. During an uptrend, prices attempt to break into higher regions, but the formation of a Bearish Engulfing pattern signals a potential reversal. Example: Look for the pattern at the end of an uptrend, where a larger bearish candle engulfs the previous bullish candle. The Bearish Engulfing pattern consists of two candles: the first is a smaller bullish candle, and the second is a larger bearish candle that completely engulfs the body of the first candle. This formation suggests a shift in momentum from buyers to sellers. According to a study conducted by the Technical Analysis Research & Education (TARE) Foundation, published in their report titled “Analyzing the Efficacy of Candlestick Patterns in Modern Markets,” the bearish engulfing pattern has a success rate of approximately 72% in predicting bearish reversals.
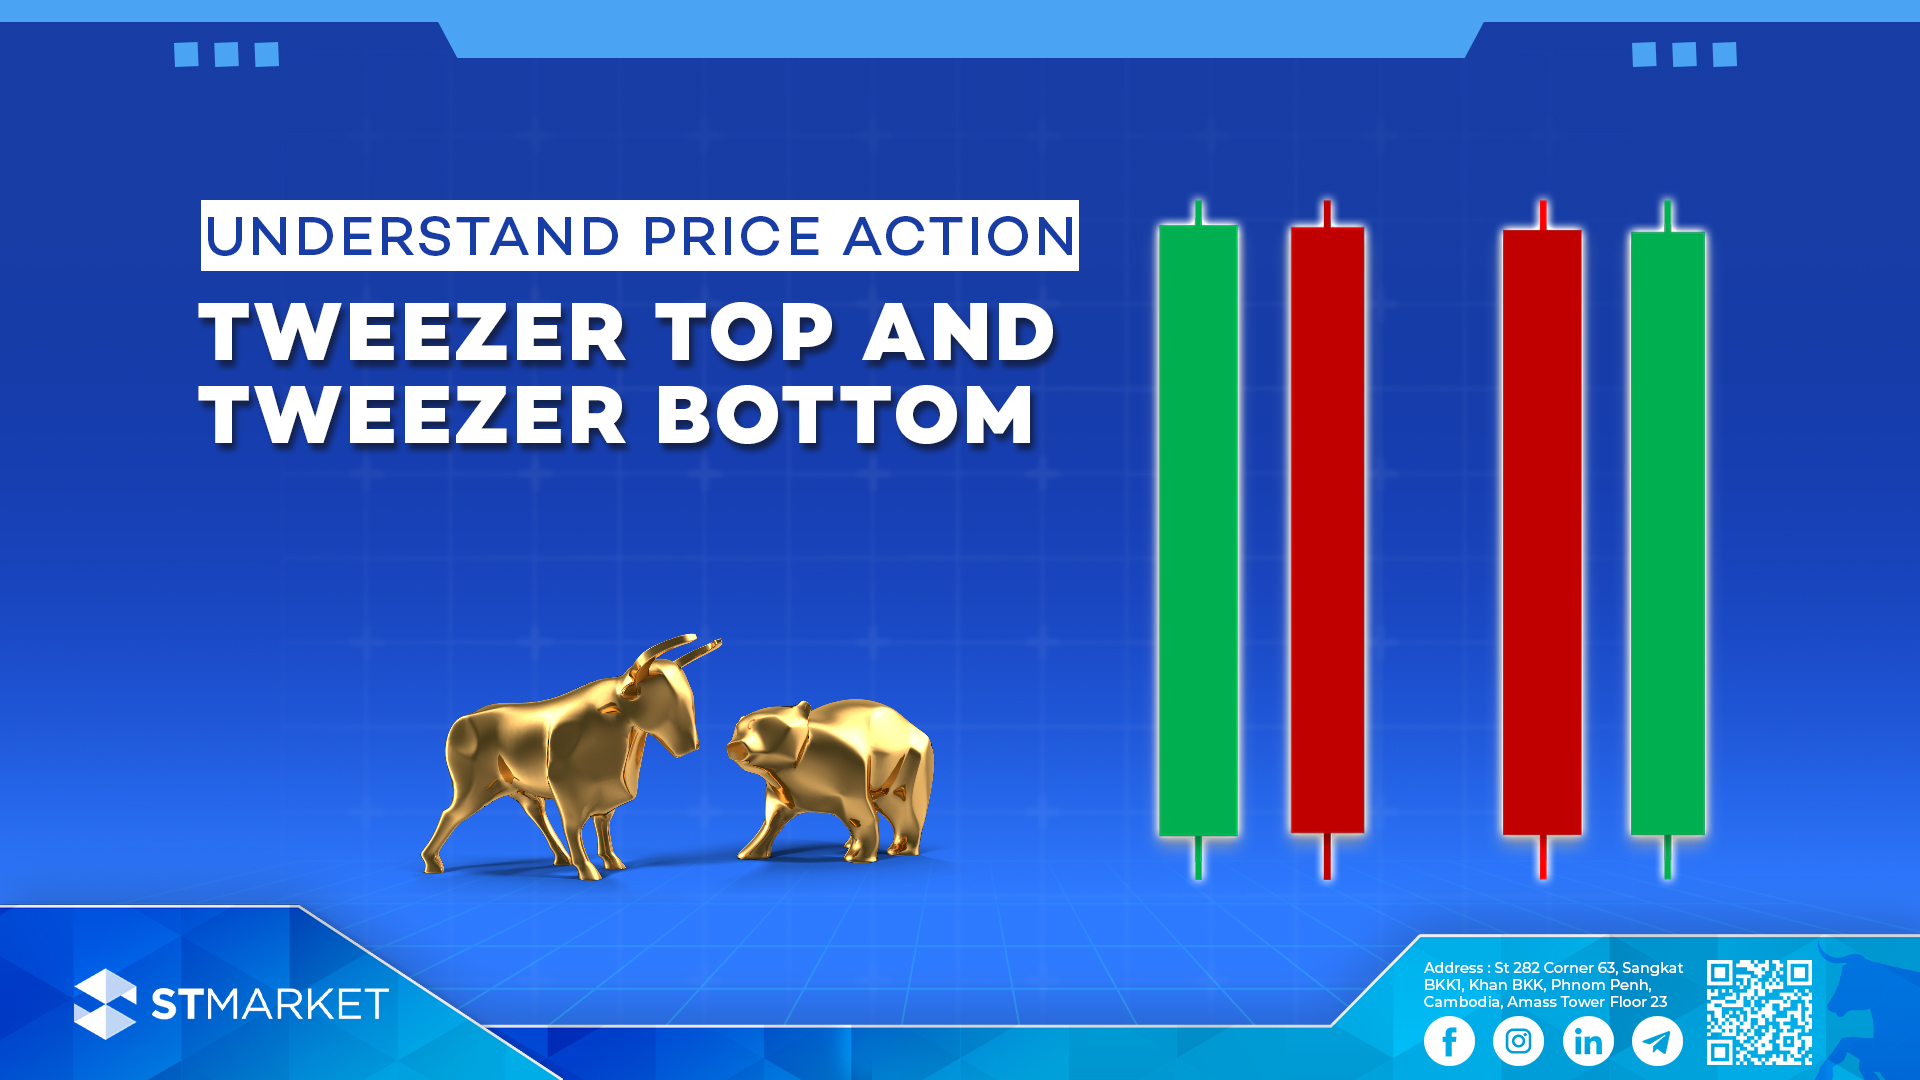
Understand Tweezer Top and Tweezer Bottom
Understand Tweezer Top and Tweezer Bottom អ្វីទៅជា Tweezer Top? និយមន័យ Tweezer Top គឺជាសញ្ញាវិលត្រឡប់នៃលំហូរចុះ វាបង្ហាញភាគច្រើននៅចុងនៃលំហូរឡើង។ រូបរាង លក្ខណៈសម្គាល់ ទម្រង់ Tweezer Top តម្លៃព្យាយាមបុកបំបែកទៅតំបន់ដែលខ្ពស់ជាងមុន ប៉ុន្តែវាបង្កើតបានជាទម្រង់ Tweezer Top ដែលនេះជាសញ្ញានៃកាវិលត្រឡប់នៃលំហូរ។ ការកំណត់ Tweezer Top នៅលើតារាង នៅខាងចុងនៃលំហូរឡើង វាបង្កើតបានជាទម្រង់ Tweezer Top អ្វីទៅជា Tweezer Bottom? និយមន័យ ទម្រង់Tweezer Bottom គឺជាសញ្ញានៃកាវិលត្រឡប់នៃលំហូរឡើង វាបង្ហាញភាគច្រើននៅចុងនៃលំហូរចុះ។ រូបរាង លក្ខណៈសម្គាល់ គំរូ Tweezer Bottom នៅក្នុងលំហូរចុះ តម្លៃព្យាយាមបុកបំបែកទៅតំបន់ដែលទាបជាងមុន ប៉ុន្តែវាបង្កើតបានជា ទម្រង់ Tweezer Bottom នេះជាសញ្ញាបង្ហាញថា កាវិលត្រឡប់នៃលំហូរចុះអាចកើតមាន ។ ការកំណត់ Tweezer Bottom នៅលើផ្ទាំងតម្លៃ នៅខាងចុងនៃលំហូរចុះ វាងបង្កើតបានជា ទម្រង់ Tweezer Bottom ការគ្រប់គ្រងហានិភ័យ ពិនិត្យមើលការសម្រេចចិត្តទិញលក់របស់អ្នកអោយបានច្បាស់លាស់។ ប្រើទំហំសមស្របនិងគ្រប់គ្រងការទិញលក់ដោយប្រើ stop-loss ដើម្បីការពារទ្រព្យសម្បត្តិរបស់អ្នក។ សេចក្តីសន្និដ្ឋាន ការយល់ដឹងនិងកំណត់អត្តសញ្ញាណ Tweezer Top, និង Tweezer Bottom អាចធ្វើឱ្យយុទ្ធសាស្រ្តទិញលក់របស់អ្នកប្រសើរឡើង។ គំរូទាំងនេះផ្តល់នូវការយល់ដឹងអំពីការបញ្ច្រាសទីផ្សារសក្តានុពល ប៉ុន្តែត្រូវបានប្រើប្រាស់ជាមួយឧបករណ៍វិភាគបច្ចេកទេសផ្សេងទៀតនិងការគ្រប់គ្រងហានិភ័យ។ What is the Tweezer Top Pattern? Definition A Tweezer Top pattern is a bearish reversal pattern that typically appears at the end of an uptrend. Appearance Characteristics The Tweezer Top pattern indicates that prices attempted to break into higher regions but formed a Tweezer Top, signaling a potential reversal. Identifying a Tweezer Top on a Chart Look for the pattern at the end of an uptrend, where two or more candles have matching highs. What is the Tweezer Bottom Pattern? Definition A Tweezer Bottom pattern is a bullish reversal pattern that typically appears at the end of a downtrend. Appearance Characteristics The Tweezer Bottom pattern indicates that prices attempted to break into lower regions but formed a Tweezer Bottom, signaling a potential reversal. Identifying a Tweezer Bottom on a Chart Look for the pattern at the end of a downtrend, where two or more candles have matching lows. Risk Management Assess your trading decisions carefully. Use appropriate position sizing and manage trades using stop-loss orders to protect your capital. Conclusion Understanding and correctly identifying Tweezer Top, and Tweezer Bottom patterns can greatly enhance your trading strategy. These patterns provide valuable insights into potential market reversals, but they should be used in conjunction with other technical analysis tools and risk management practices.
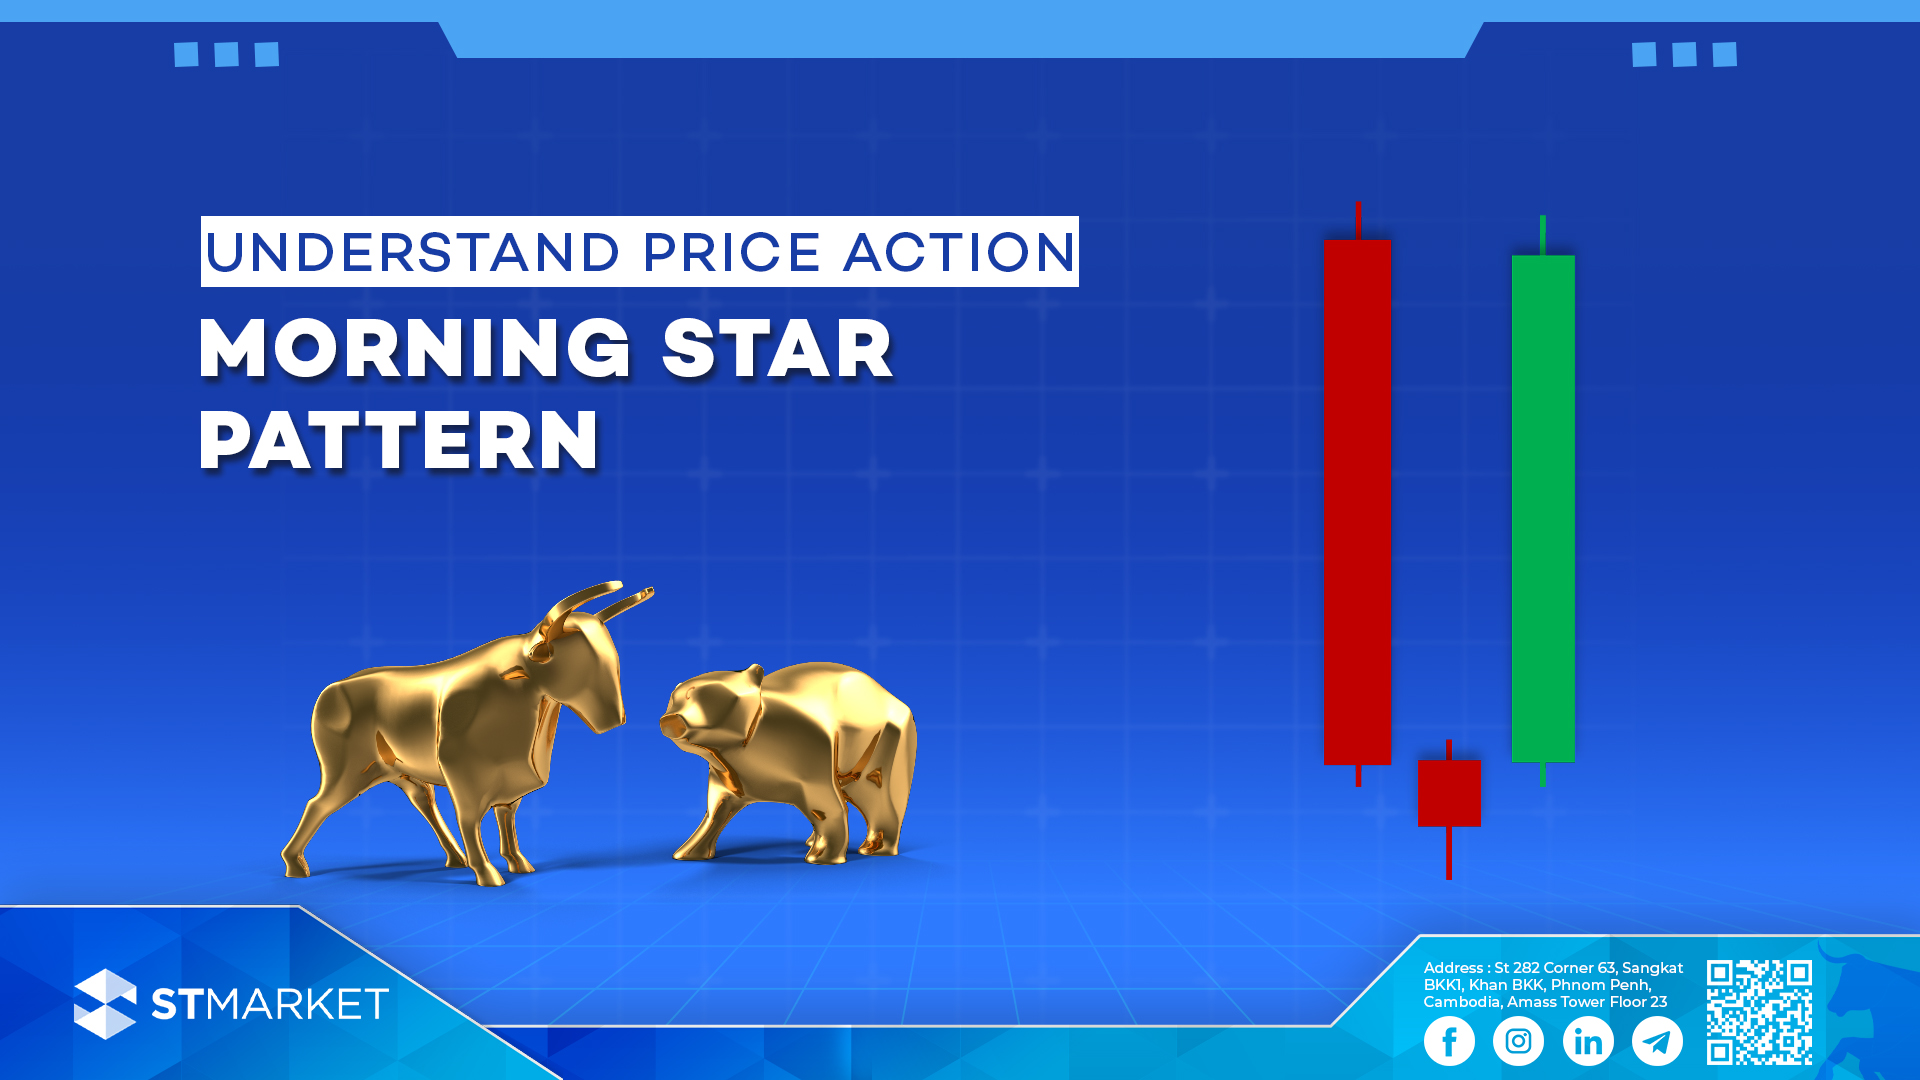
Understand Morning Star Pattern
Understand Morning Star Pattern អ្វីទៅជា Morning Star Pattern? និយមន័យ Morning Star Pattern គឺជាសញ្ញាវិលត្រឡប់នៃលំហូរចុះ វាបង្ហាញភាគច្រើននៅចុងនៃលំហូរចុះ។ រូបរាង លក្ខណៈសម្គាល់ Morning Star Pattern គឺជាទម្រង់នៃការវិលត្រឡប់ពីលំហូរចុះមកជាលំហូរឡើងវិញដែលបានបង្កើតឡើងដោយទាន៣។ ដែលទានទី១គឺជាទម្រងទានចុះធំមួយ។ ទានទី២គឺជាទានដែលតូច ពេលខ្លះអាចជាទម្រង់ doji ដែលបង្ហាញពីភាពមិនច្បាស់លាស់នៃអ្នកចូលរួមនៅក្នុងទីផ្សារ ហើយក៏បង្ហាញផងដែរថាកម្លាំងអ្នកលក់កំពុងតែតែចុះក្សោយ។ ទានទី៣ជាទានដែលឡើងខ្លាំងមួយដែលបង្ហាញពីការផ្លាស់ប្តូរលំហូរ។ ឧទាហរណ៍ ទម្រង់ទានមួយនេះវាជាសញ្ញាបញ្ជាក់យ៉ាងរឹងមាំមួយថាហ្នឹងមានការផ្លាសប្តូរលំហូរនៅពេលខាងមុខនេះ។ អ្នកជួញដូរតែងប្រើប្រាស់វាដើម្បីកំណត់កំរិតការខាតនៅខាងក្រោម ទានទី២ ឬទានទី៣។ ការសិក្សារមួយក្រោមប្រធានបទ “Candlestick Charting and Technical Analysis: An Empirical Analysis” ធ្វើឡើងដោយលោក Cheol-Ho Park and Scott H. Irwin ដែលបានបោះពុម្ភផ្សាយនៅក្នុងបោះពុម្ភផ្សាយនៅក្នុងទិនានុប្បវត្តិនៃទីផ្សារហិរញ្ញវត្ថុ បានធ្វើការវិភាគលើទម្រង់ទានផ្សេងៗ និងអត្រាជោគជ័យរបស់ពួកគេក្នុងការព្យាករណ៍ចលនាទីផ្សារ។ យោងតាមការរកឃើញរបស់ពួកគេ ទម្រង់ morning star បង្ហាញពីអត្រាជោគជ័យប្រហែល 65% ក្នុងការព្យាករណ៍ពីការកើនឡើងនៃទីផ្សារបន្ទាប់ពីវាបានបង្ហាញខ្លួន។ (English Version) What is the Morning Star Pattern? Definition A pattern is a bullish reversal pattern that typically appears at the end of a downtrend. Appearance Characteristics The morning star candlestick pattern is a bullish reversal pattern which is made up of three candles. The first candle is a strong bearish candle. The second candle is a small candle, sometimes doji which shows the indecision of the market participants and also shows that the sellers are getting weak។ The third candle is a strong bullish candle which marks the trend change. Example This candlestick pattern is a strong indication of the potential trend reversal. Traders use this pattern to set up stop losses below the doji or the bullish candle. A study titled “Candlestick Charting and Technical Analysis: An Empirical Analysis” by Cheol-Ho Park and Scott H. Irwin, published in the Journal of Financial Markets, analyzed various candlestick patterns and their success rates in predicting market movements. According to their findings, the morning star pattern demonstrated a success rate of approximately 65% in forecasting bullish reversals.
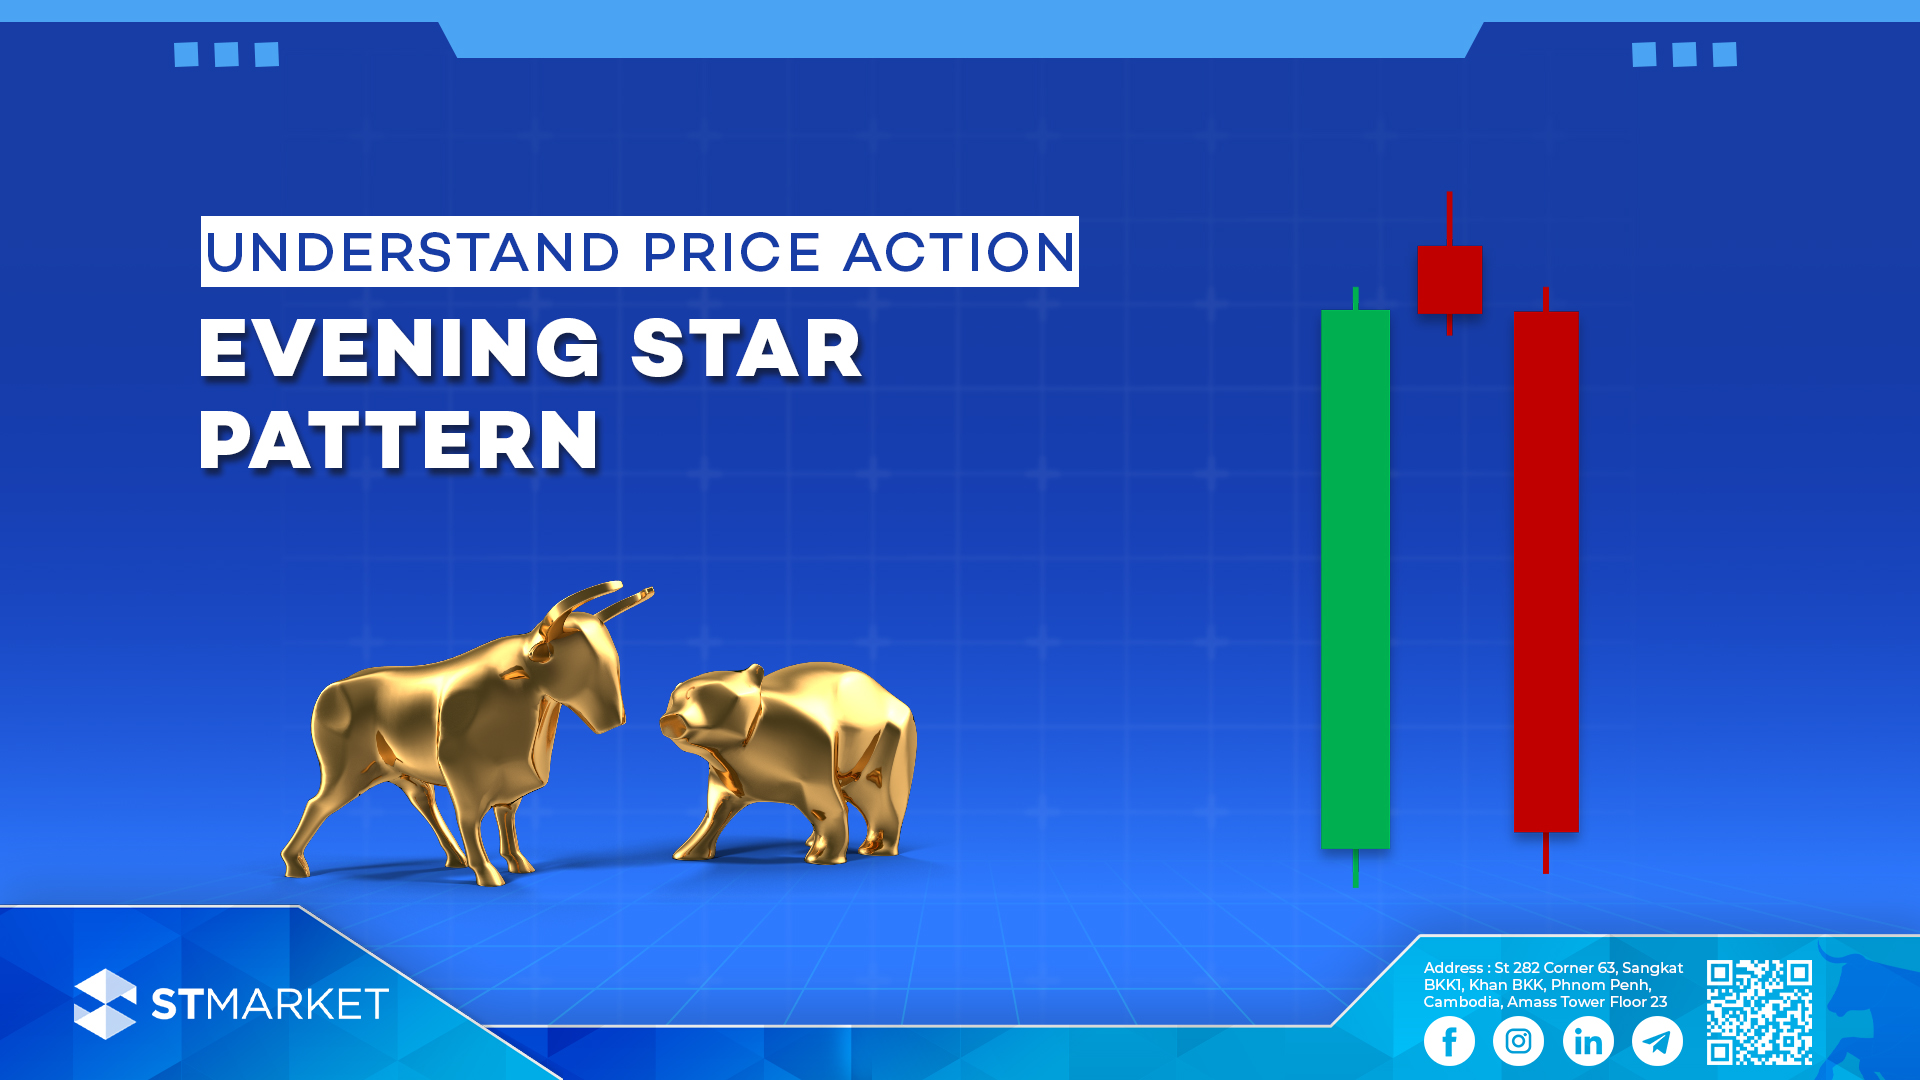
Understand Evening Star Pattern
Understand Evening Star Pattern អ្វីទៅជា Evening Star Pattern? និយមន័យ Evening Star Pattern គឺជាសញ្ញាវិលត្រឡប់នៃលំហូរឡើង វាបង្ហាញភាគច្រើននៅចុងនៃលំហូរឡើង។ រូបរាង លក្ខណៈសម្គាល់ Evening Star Pattern គឺជាទម្រង់នៃការវិលត្រឡប់ពីលំហូរឡើងមកជាលំហូរចុះវិញដែលបានបង្កើតឡើងដោយទាន៣។ ដែលទានទី១គឺជាទម្រងទានឡើងធំមួយ។ ទានទី២គឺជាទានដែលតូច ពេលខ្លះអាចជាទម្រង់ doji ដែលបង្ហាញពីភាពមិនច្បាស់លាស់នៃអ្នកចូលរួមនៅក្នុងទីផ្សារ ហើយក៏បង្ហាញផងដែរថាកម្លាំងអ្នកលក់កំពុងតែចុះខ្សោយ។ ទានទី៣ជាទានដែលចុះខ្លាំង ដែលបង្ហាញពីការផ្លាស់ប្តូរលំហូរ។ ឧទាហរណ៍ ទម្រង់ទានមួយនេះវាជាសញ្ញាបញ្ជាក់យ៉ាងរឹងមាំមួយថាហ្នឹងមានការផ្លាសប្តូរលំហូរនៅពេលខាងមុខនេះ។ អ្នកជួញដូរតែងប្រើប្រាស់វាដើម្បីកំណត់កម្រិតការខាតនៅខាងលើ ទានទី២ ឬទានទី៣។ ការសិក្សារមួយដែលបានបានចេញផ្សាយនៅ“Journal of Technical Analysis” ក្រោមប្រធានបទ “Evaluating the Performance of Candlestick Patterns in Financial Markets” ធ្វើឡើងដោយលោក David Aronson យោងតាមការរកឃើញរបស់ពួកគេ ទម្រង់ morning star បង្ហាញពីអត្រាជោគជ័យប្រហែល 69% ក្នុងការព្យាករណ៍ពីការធ្លាក់ចុះនៃទីផ្សារបន្ទាប់ពីវាបានបង្ហាញខ្លួន។ (English Version) What is the Evening Star Pattern? Definition A pattern is a bearish reversal pattern that typically appears at the end of an uptrend. Appearance Characteristics An evening star candlestick pattern is a bearish reversal pattern. Evening star pattern consists of three candles. The first candle is a robustly positive one. The second candle is a doji, which indicates both buyer weakness and the indecision of the market players. A strong bearish candle that marks the trend change is the third one. Example The strong bullish candle at the beginning represents the buying pressure in the market, while the doji candle that follows indicates indecision and a weakening of the buying pressure. The final strong bearish candle then confirms the bearish reversal, signaling that the sellers have taken control of the market. According to a study published in the “Journal of Technical Analysis” by David Aronson and Timothy Masters, titled “Evaluating the Performance of Candlestick Patterns in Financial Markets,” the Evening Star pattern has a success rate of approximately 69% in predicting bearish reversals.
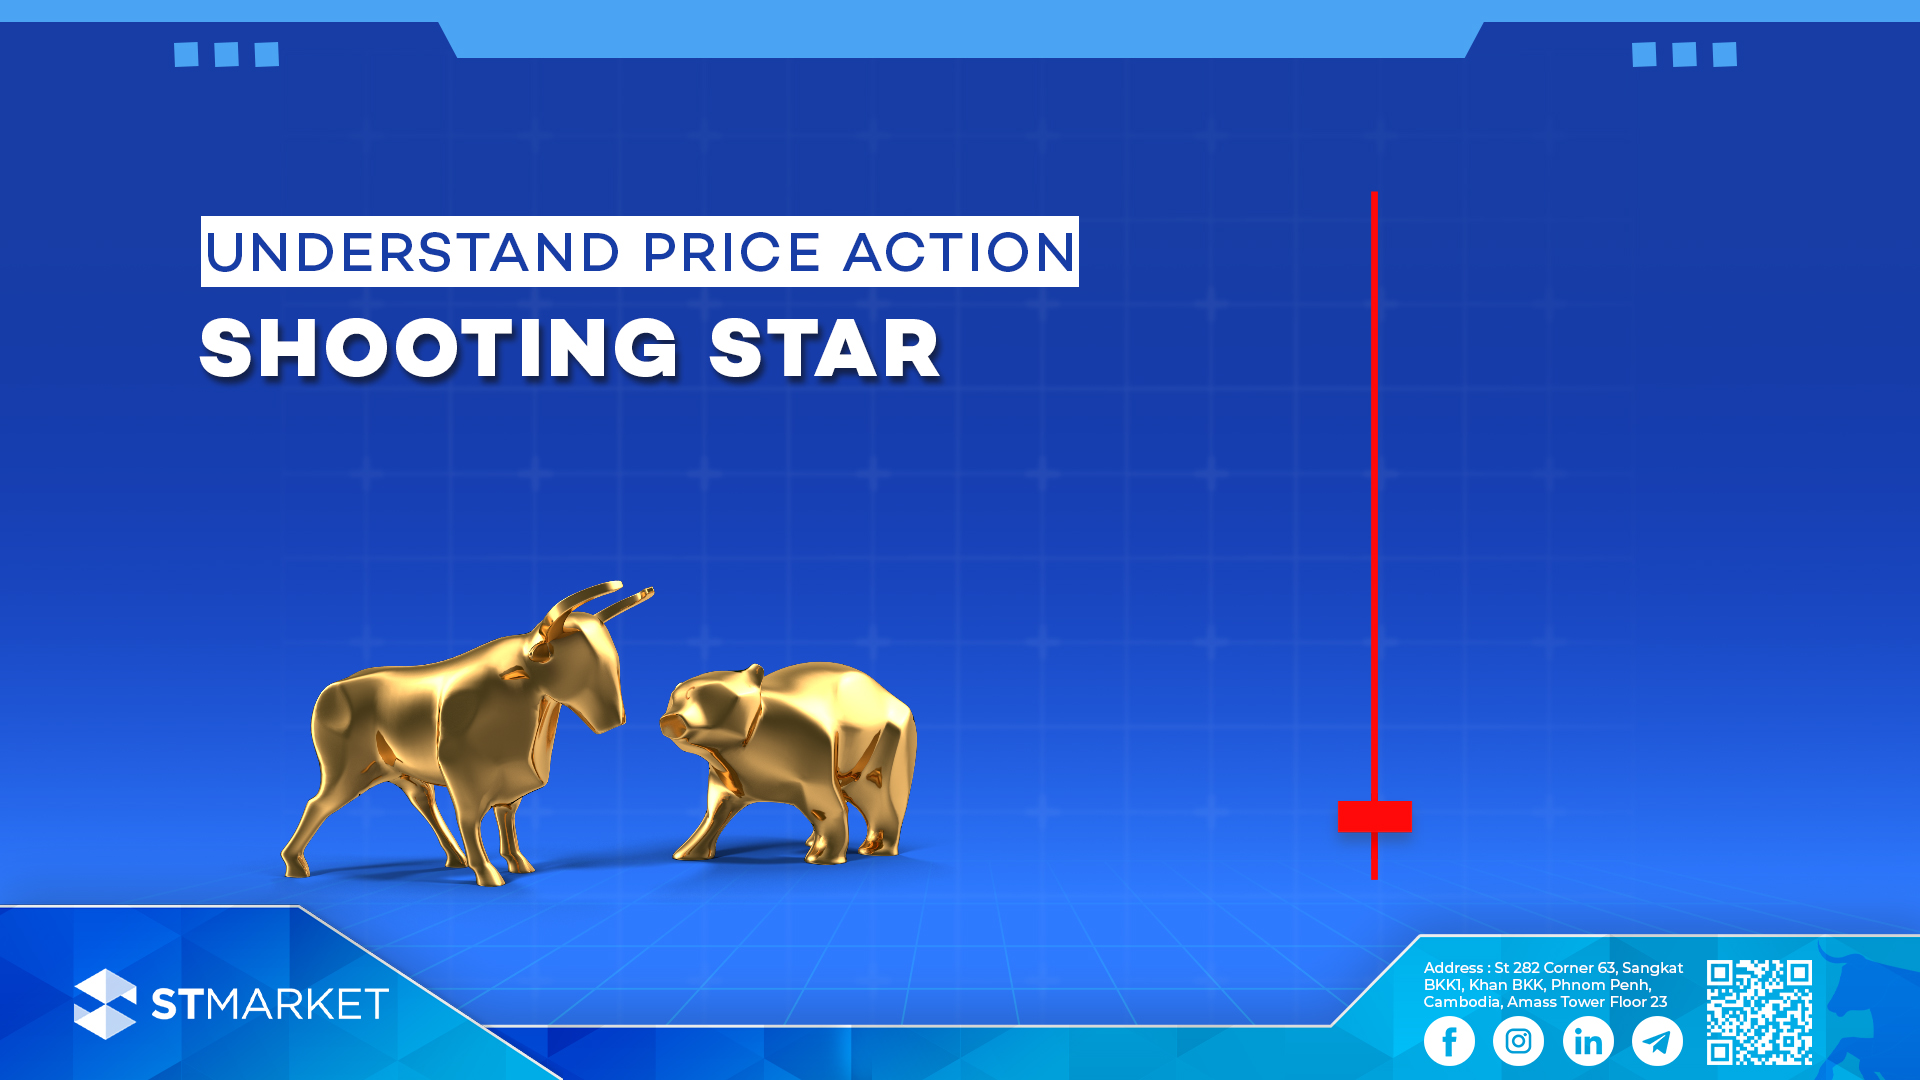
Understanding Shooting Star Candlestick Patterns
Understanding Shooting Star Candlestick Patterns តើអ្វីទៅជា Shooting Star Candlestick Pattern? និយមន័យ Shooting Star candlestick Pattern គឺជាទម្រង់នៃសញ្ញាវិលត្រឡប់ដែលមានតែមួយទានគត់។ វាមានស្រមោលខាងលើវែងនិងមានតួខ្លួនតូច។ វាប្រាប់យើងថានឹងមានការប្តូរទិសពីឡើងមកចុះ នៅពេលដែលវាកើត។ រូបរាង លក្ខណៈសម្គាល់ ក្នុងទិសដៅកើនឡើង Shooting Star បានបង្កើតឡើងនៅពេលដែលតម្លៃព្យាយាមឡើងខ្ពស់ ប៉ុន្តែជាមួយនឹងចំនួនអ្នកទិញច្រើនដែលអាចធ្វើឱ្យតម្លៃបានធ្លាក់ចុះ នោះShooting Star ត្រូវបានបង្កើតឡើង។ ទាំងនេះបានសបញ្ជាក់ថា ចំនួនអ្នកទិញមានច្រើន ហើយការផ្លាស់ប្តូរទិសអាចនឹងកើតមានឡើង។ ឩទាហរណ៍ Shooting Star patternកើតឡើងនៅពេលដែលទីផ្សារស្រាប់តែមានការឈប់ភា្លមៗនៅពេលដែលវាកំពុងរត់ក្នុងលំហូរឡើង។ ស្រមោលខាងលើកាន់តែវែងបញ្ជាក់ប្រាប់យើងថាអ្នកទិញព្យាយាមរុញទីផ្សារអោយឡើង ប៉ុន្តែអ្នកលក់បានរុញវាត្រឡប់មកវិញយ៉ាងជោគជ័យ បង្កើតបានទៅជាស្រមោលដ៏វែង។ ទម្រង់បែបនេះផ្តល់សញ្ញាប្រាប់យើងថាអាចហ្នឹងមានការផ្លាស់ប្តូរសន្ទុះកម្លាំងនៅក្នុងទីផ្សារ ដែលប្រាប់យើងថាអ្នកលក់កំពុងគ្រប់គ្រងទីផ្សារ ហើយលំហូរដែលកំពុងតែឡើងអាចហ្នឹងប្តូរមកចុះវិញ។ ការសិក្សារមួយក្រោមប្រធានបទ “The Performance of Candlestick Patterns in Financial Markets” ដែលបានបោះពុម្ភផ្សារយនៅក្នុង Journal of Technical Analysis ដោយលោកDr. Thomas Bulkowski ដែលឈានមុខគេក្នុងការវិភាគ chart patternsបានរកឃើញថា Shooting Star pattern មានអត្រាជោគជ័យរហូតដល់ 59% ក្នុងការព្យាករណ៍ថាទិសដៅផ្សារនឹងមានការវិលត្រឡប់ពីឡើងមកចុះវិញ។ What is Shooting Star Candlestick Pattern? Definition A shooting star is a bearish reversal candlestick pattern that typically forms after an uptrend. It signals that a potential top is forming and that the price may start to fall. Appearance Characteristics The shooting star candlestick pattern is a bearish reversal signal that consists of a single candle. It features a long upper wick and a small or non-existent body. Confirmation of this pattern occurs when a strong bearish candle appears after the shooting star. Example The shooting star pattern forms when the market suddenly rejects bullish momentum. The long upper wick signifies that buyers tried to drive the price up, but sellers successfully pushed it back down, creating the extended wick. This pattern signals a possible shift in market sentiment, indicating that bears may be gaining control and the uptrend could reverse. In a study titled “The Performance of Candlestick Patterns in Financial Markets” published in the Journal of Technical Analysis, Dr. Thomas Bulkowski, a leading authority on chart patterns, found that the Shooting Star pattern has a success rate of around 59% in forecasting bearish reversals.