
1.ការវិភាគបែបមូលដ្ឋាន (Fundamental analysis) ការវិភាគបែបមូលដ្ឋាន គឺជាការសិក្សាលើកត្តាសេដ្ឋកិច្ច ហិរញ្ញវត្ថុ និងកត្តាផ្សេងៗទៀត ដើម្បីយល់ពីតម្លៃពិតនៃទ្រព្យសកម្ម ឬផលិតផលហិរញ្ញវត្ថុ។ វាពាក់ព័ន្ធនឹងការវិភាគទិន្នន័យម៉ាក្រូសេដ្ឋកិច្ច ដូចជាអត្រាការប្រាក់ ផលិតផលក្នុងស្រុកសរុប(GDP) អតិផរណា(Inflation) និងទិន្នន័យការងារ(Unemployment Rate) ឬទិន្នន័យផ្សេងទៀតដើម្បីដឹងពីទិសដៅសក្តានុពលនៃទីផ្សារភាគហ៊ុន ទីផ្សារមូលបត្របំណុល និង ទីផ្សាររូបិយប័ណ្ណ។ 2. ការវិភាគបែបបច្ចេកទេស (Technical analysis) ការវិភាគបែបបច្ចេកទេស គឺជាការសិក្សាលើក្រាប និងទំនោររបស់ផលិតផលហិរញ្ញវត្ថុ ដើម្បីស្វែងរកនិន្នាការរបស់ទីផ្សារ និងធ្វើការសម្រេចចិត្តទិញឬលក់ផលិតផលហិរញ្ញវត្ថុដោយមានអំណះអំណាងត្រឹមត្រូវ។ ការវិភាគបែបបច្ចេកទេសពឹងផ្អែកលើសូចនាករបឋម ដូចជា Support, Resistance ឬលើសូចនាករបច្ចេកទេសដូចជា Moving Average, Oscillators ជាដើម។ 3. ចិត្តវិទ្យានៃការចូលវិនិយោគ (Trading psychology) ពាក់ព័ន្ធនឹងការគ្រប់គ្រងអារម្មណ៍របស់យើងនៅពេលចូលទីផ្សារតាមរយៈការបង្កើនទម្លាប់ល្អៗ ការអនុវត្តតាមផែនការវិនិយោគឲ្យបានត្រឹមត្រូវនិងទៀងទាត់ និងប្រកាន់ជាប់ជានិច្ចនូវវិន័យផ្ទាល់ខ្លួនពេលចូលទីផ្សារ។ 4. ការគ្រប់គ្រងហានិភ័យ (Risk management) ពាក់ព័ន្ធនឹងការគ្រប់គ្រងហានិភ័យនៃការខាតបង់ដោយកំណត់ stop-loss ត្រឹមត្រូវ ព្រមទាំងមានយុទ្ធសាស្រ្តគ្រប់គ្រងហានិភ័យច្បាស់លាស់ផ្សេងទៀត។ ឧទាហរណ៍ថាលោកអ្នកអាចប្រថុយ 1% ឬ 2% នៃទឹកប្រាក់ក្នុងគណនីរបស់លោកអ្នកក្នុងការចូលផ្សារក្នុងមួយថ្ងៃ ឬ 4% ក្នុងមួយសប្តាហ៍ ឬក្នុងកម្រិតណាមួយដែលលោកអ្នកអាចទទួលយកបាន ដើម្បីរក្សាការខាតបង់របស់យើងឲ្យនៅក្នុងកម្រិតមួយដែលយើងអាចគ្រប់គ្រងបាន។ (English Version ) 1. Fundamental analysis Fundamental analysis is a study of economic, financial, and other factors to understand the true value of the intrinsic value of a financial product ( asset ). It involves analyzing macroeconomic data such as GDP, the Inflation rate, the Unemployment Rate, or other data to paint a longer-term picture of the economy and understand the potential direction of the Stock market, the Bond market, and the Forex market. 2. Technical analysis Technical analysis is the study of graphs to reflect market sentiments of financial products to explore market trends and make logical decisions to buy or sell financial products. Technical analysis relies on primary indicators such as Support, Resistance or on technical indicators such as Moving Averages, Oscillators, and so on. 3. Trading psychology Trading psychology is about our mindset and emotion management when entering the market. This can be achieved through creating good trading habits, implementing a well-thought-out trading plan, and following up regularly with the plan while always adhering to our plan with proper discipline when entering the market. 4. Risk management Risk management is the process of identifying and managing potential risks associated with trading. This includes setting the right stop-loss and having clear risk management strategies. To manage risk, you can limit the amount of equity you risk when entering the market. For example, you can choose to risk 1% or 2% of your trading account’s equity for one day or 4% for a week. You can also choose any other risk level that you are comfortable with and that allows you to keep losses at a level that you can control. Reference: The Four Pillars of Trading | LAT London learntotradethemarket.com
🔍📦What is Lot?
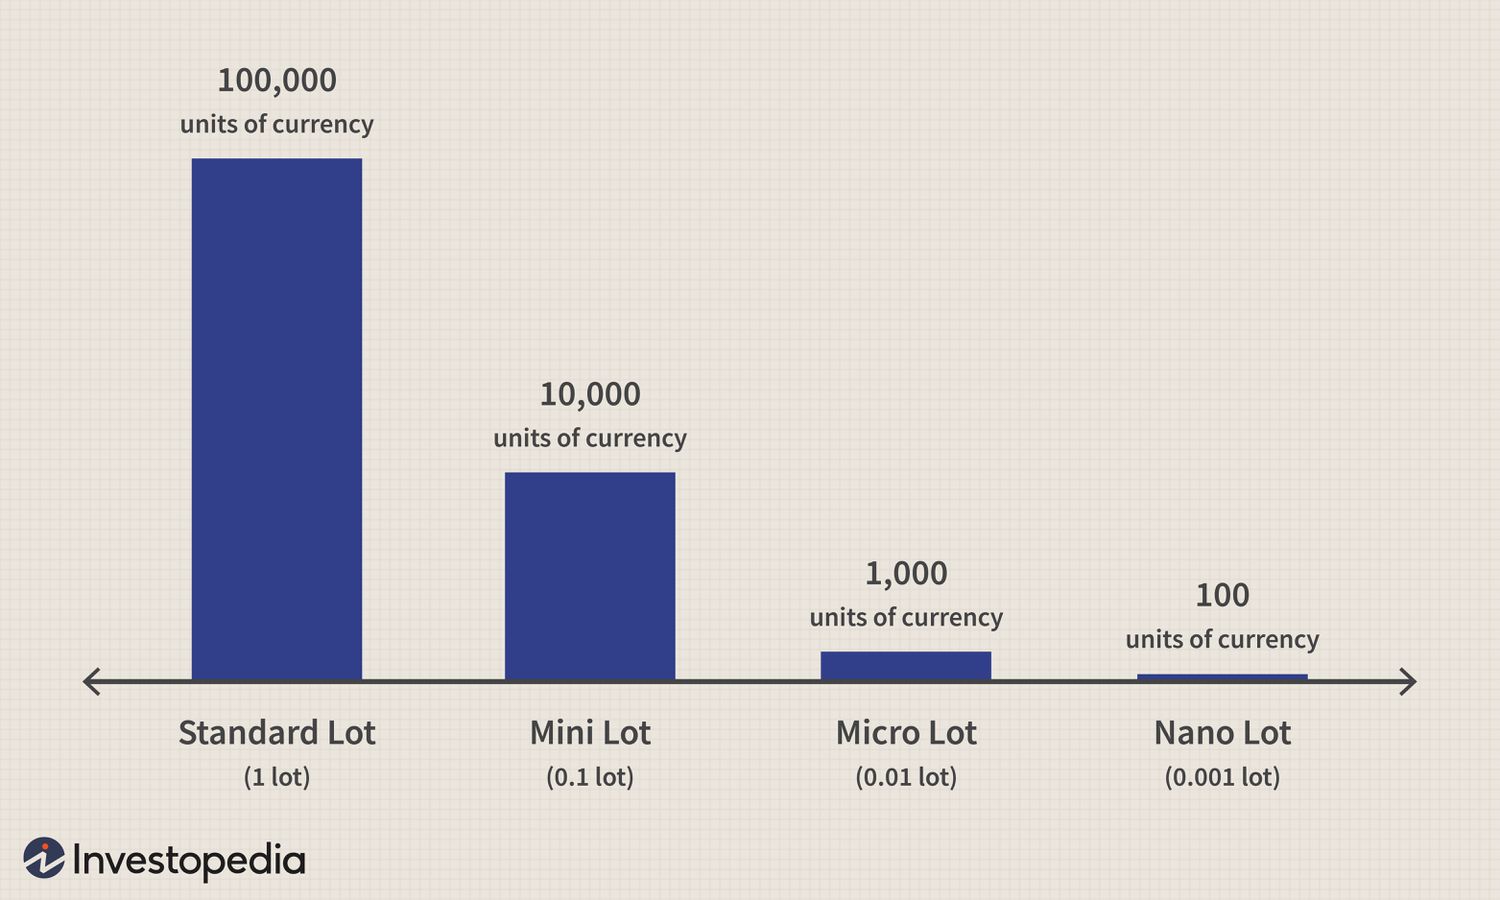
📦ពាក្យថា Lot នៅក្នុងការជួញដូរ សំដៅដល់ចំនួនឯកតាស្តង់ដារនៃទ្រព្យសកម្មដែលលោកអ្នកទិញ ឬលក់ក្នុងប្រតិបត្តិការណាមួយ។ Lot ត្រូវបានប្រើដើម្បីធ្វើឱ្យការជួញដូរកាន់តែងាយស្រួល ដោយសារទ្រព្យសកម្មមួយចំនួនមានតម្លៃខ្ពស់ ឬទាបពេក ដែលពិបាកក្នុងការគណនាការជួញដូរក្នុងឯកតាតែមួយ។ ឧទាហរណ៍៖ ភាគហ៊ុនមួយរបស់ក្រុមហ៊ុន Tesla (TSLA) មានតម្លៃប្រហែល $២៥១.៤៥ គិតត្រឹមថ្ងៃទី ៧ ខែសីហា ឆ្នាំ ២០២៣ ដូច្នេះការទិញភាគហ៊ុន ១០០ ហ៊ុន នឹងមានតម្លៃ ២៥,១៤៥ ដុល្លារ។ នោះគឺជាចំនួនដ៏ធំសម្រាប់អ្នកវិនិយោគភាគច្រើន ដូច្នេះពួកគេអាចប្រើប្រាស់ lot ដើម្បីជួញដូរភាគហ៊ុនក្នុងទំហំតូចៗ។ ក្នុងទីផ្សារភាគហ៊ុន មួយ lot ជាធម្មតាស្មើនឹង ១០០ ហ៊ុន ដែលមានន័យថា TSLA មួយ lot មានតម្លៃ ២៥,១៤៥ ដុល្លារ។ ទំហំ lot អាចប្រែប្រួលអាស្រ័យលើប្រភេទនៃផលិតផលហិរញ្ញវត្ថុដែលលោកអ្នកកំពុងជួញដូរ។ ឧទាហរណ៍ នៅក្នុងទីផ្សារ Forex មួយ lot ជាធម្មតាស្មើនឹង ១០០,០០០ ឯកតានៃរូបិយប័ណ្ណមូលដ្ឋាន។ នេះមានន័យថា បើលោកអ្នកចង់ទិញ ឬលក់ មួយ lot នៃគូ EUR/USD លោកអ្នកកំពុងតែជួញដូរ ១០០,០០០ អឺរ៉ូជាដុល្លារអាមេរិក ឬផ្ទុយទៅវិញ។ លើសពីនេះ ទំហំ lot ដែលមានទំហំតូចជាងនេះមានដូចជា មីនី lot (10,000 ឯកតា) មីក្រូ lot (1,000 ឯកតា) និង ណាណូ lot (100 ឯកតា)។ ទំហំ lot តូចៗទាំងនេះអនុញ្ញាតឱ្យលោកអ្នកធ្វើការជួញដូរជាមួយនឹងដើមទុនតិច និងហានិភ័យទាបជាងមុន។ ដើម្បីពន្យល់ពាក្យ lot ឲ្យកាន់តែងាយស្រួលយល់ យើងនឹងងាកមកមើលឧទាហរណ៍ពីជីវិតរស់នៅប្រចាំថ្ងៃមកបកស្រាយ។ លោកអ្នកអាចប្រៀបធៀបការជួញដូរជា lot ទៅនឹងការទិញគ្រឿងទេសក្នុងទំហំធំ ឬការទិញក្នុងលក្ខណៈបោះដុំ។ ឧទាហរណ៍ ប្រសិនបើអ្នកចង់ទិញស៊ុត លោកអ្នកតែងតែទិញវាជាប្រអប់នៅតាមផ្សារ ដែលក្នុងមួយប្រអប់មាន ១២ ស៊ុត ឬស្មើនឹងមួយឡូ។ ការទិញស៊ុតដោយរាប់ជាឡូ ឬប្រអប់មានភាពងាយស្រួលជាងការទិញរាយ។ ដូចគ្នានេះដែរ ប្រសិនបើអ្នកចង់ទិញទឹកដោះគោ អ្នកតែងតែទិញវាដោយលីត្រ ឬ Gallon ដែលអាចចាត់ទុកថាជាទំហំ lot របស់វត្ថុរាវ។ ការទិញទឹកដោះគោដោយលីត្រ ឬ Gallon មានប្រសិទ្ធភាព និងសន្សំសំចៃជាងការទិញដោយមីលីលីត្រ ឬអោន (Ounce)។ ⏬English Below⏬ 📦A lot in trading is a standardized number of units of an asset that you buy or sell in each transaction. A lot is used to make trading more convenient and efficient, as some assets have very high or low values that would be impractical to trade in single units. 💡For example: One share of Tesla (TSLA) costs about $251.45 as of August 7, 2023, so buying 100 shares would cost $25,145. That is a very large amount for most traders, so they can use lots to trade smaller quantities of shares. A lot size for stocks is usually 100 shares, which means that one lot of TSLA would cost $25,145. A lot size can vary depending on the type of asset being traded. For example, in forex trading, a lot size is usually 100,000 units of the base currency. This means that if you want to buy or sell one lot of EUR/USD, you need to exchange 100,000 euros for US dollars, or vice versa. However, there are also smaller lot sizes available, such as mini lots (10,000 units), micro lots (1,000 units), and nano lots (100 units). These smaller lot sizes allow traders to trade with less capital and lower risk. To compare a lot in trading to daily life, you can think of buying groceries in bulk. For example, if you want to buy eggs, you usually buy them by the dozen, which is a lot size of 12 eggs. Buying eggs by the dozen is more convenient and cheaper than buying them individually. Similarly, if you want to buy milk, you usually buy it by the liter or gallon, which are lot sizes of liquid volume. Buying milk by the liter or gallon is more efficient and economical than buying it by the milliliter or ounce.

What’s the Reason Behind FX Markets Being Closed During Weekends?
ទីផ្សាររូបិយប័ណ្ណអន្តរជាតិ គឺជាទីផ្សារហិរញ្ញវត្ថុដែលធំជាងគេបំផុត និងត្រូវបានចាត់ទុកថាជាទ្រព្យរាវបំផុតនៅលើពិភពលោក ហើយរូបិយប័ណ្ណនេះទៀតសោតត្រូវបានជួញដូរ ២៤ ម៉ោងក្នុងមួយថ្ងៃ ប្រាំថ្ងៃក្នុងមួយសប្តាហ៍។ ទោះជាយ៉ាងណាក៏ដោយទីផ្សារនេះមិនបើកដំណើរការនៅចុងសប្តាហ៍នោះទេ មានន័យថាមិនមានសកម្មភាពជួញដូរណាមួយនោះទេចាប់ពី ល្ងាចថ្ងៃសុក្ររហូតដល់ល្ងាចថ្ងៃអាទិត្យ។ តើមកពីមូលហេតុអ្វីទៅ? តោះបើចង់ដឹងសូមមកតាមដានទាំងអស់គ្នា!🔔🔔 កត្តាម៉ាក្រូសេដ្ឋកិច្ច និងព្រឹត្តិការណ៍ភូមិសាស្ត្រនយោបាយ ទីផ្សាររូបិយប័ណ្ណអន្តរជាតិទទួលឥទ្ធិពលពីម៉ាក្រូសេដ្ឋកិច្ច និងព្រឹត្តិការណ៍ភូមិសាស្ត្រនយោបាយ ដែលប៉ះពាល់ដល់ការផ្គត់ផ្គង់ និងតម្រូវការរូបិយប័ណ្ណអន្តរជាតិលើទីផ្សារ។ កត្តាទាំងនេះជាធម្មតាអវត្តមាន ឬមានតិចតួចបំផុតនៅចុងសប្តាហ៍ ដោយសារតែអាជីវកម្ម និងស្ថាប័នភាគច្រើនត្រូវបានបិទ ហើយសារព័ត៌មានភាគច្រើនមិនរាយការណ៍ពីព្រឹត្តិការណ៍សំខាន់ៗណាមួយកំឡុងពេលចុងសប្តាហ៍នោះឡើយ។ កត្តាមនុស្ស (Human Factor) មូលហេតុចម្បងមួយដែលទីផ្សារ រូបិយប័ណ្ណអន្តរជាតិបិទនៅចុងសប្តាហ៍គឺដោយសារតែទីផ្សារត្រូវបានជំរុញដោយកត្តាមនុស្សពោលគឺអ្នកវិនិយោគត្រូវការពេលសម្រាកពីការទិញលក់នៅលើទីផ្សារ។ ការជួញដូរនៅក្នុងទីផ្សាររូបិយប័ណ្ណអន្តរជាតិអាចធ្វើឲ្យអ្នកវិនិយោគប្រឈមនឹងភាពតានតឹង ជាពិសេសសម្រាប់ពាណិជ្ជករដែលចូលរួមក្នុងការជួញដូរប្រេកង់ខ្ពស់ ឬប្រើយុទ្ធសាស្រ្ត និងសូចនាករស្មុគស្មាញច្រើន។ ដូច្នេះហើយពួកគាត់ត្រូវការពេលឈប់សម្រាកពីរាល់សកម្មភាពទិញលក់នៅពេលចុងសប្តាហ៍។ កត្តាបច្ចេកទេស ហេតុផលទីបីដែលទីផ្សារ Forex បិទនៅចុងសប្តាហ៍គឺដើម្បីអនុញ្ញាតឱ្យមានតំហែទាំជាប្រចាំសម្រាប់ប្រព័ន្ធទិញលក់និង Platform ផ្សេងៗទៀត។ អ្នកវិនិយោគក្នុងទីផ្សាររូបិយប័ណ្ណអន្តរជាតិច្រើនប្រើបច្ចេកវិទ្យា និងកម្មវិធីទំនើបដើម្បីផ្តល់ឱ្យពាណិជ្ជករនូវលទ្ធភាពចូលទៅកាន់ទីផ្សារកាន់តែខ្ពស់។ Platform និងប្រព័ន្ធទាំងនេះទាមទារការថែទាំ និងការ Update ជាប្រចាំ ដើម្បីធានាថាវាអាចដំណើរការបានរលូន និងសុវត្ថិភាព។ |English Version| The forex market is the largest and most liquid financial market in the world, where currencies are traded 24 hours a day, five days a week. However, the market is not open on weekends, which means that there is no trading activity from Friday evening to Sunday evening. Why is that? Macroeconomic factors and geopolitical events The forex market is influenced by macroeconomic factors and geopolitical events that affect the supply and demand of currencies. These factors are usually absent or minimal during the weekends, as most of the businesses and institutions are closed and most of the news outlets are not reporting any major events. Human Factor One of the main reasons why the forex market closes on weekends is because the market is driven by human beings, who need rest and leisure time. Trading in the forex market can be stressful and demanding, especially for traders who engage in high-frequency trading or use complex strategies and indicators. Technical Factor A third reason why the forex market closes on weekends is that it allows for routine maintenance and updates of trading platforms and systems. Forex brokers use sophisticated technology and software to provide traders with access to the forex market. These platforms and systems require regular maintenance and updates to ensure that they are running smoothly and securely.

Why Should You Own A CFD Trading Account?
ហេតុអ្វីបានជាអ្នកត្រូវការគណនីជួញដូរ CFD? តើអ្នកធ្លាប់ឆ្ងល់ពីរបៀបចូលទីផ្សារហិរញ្ញវត្ថុពិភពលោកដោយមិនចាំបាច់មានទ្រព្យសម្បត្តិមូលដ្ឋានទេ? គណនីជួញដូរតាមបែបគម្លាតតម្លៃ (Contract For Difference) អាចនឹងជាដំណោះស្រាយដ៏ល្អមួយសម្រាប់លោកអ្នក។ ខាងក្រោមជាមូលហេតុមួយចំនួនដែលអ្នកគួប្បីដឹង ភាពងាយស្រួលក្នុងការចូលទៅកាន់ទីផ្សារហិរញ្ញវត្ថុពិភពលោក បច្ចេកវិទ្យាធ្វើឱ្យជីវិតរបស់យើងកាន់តែងាយស្រួល ហើយវាអនុញ្ញាតឱ្យអ្នកចូលទៅកាន់ទីផ្សារហិរញ្ញវត្ថុដ៏ធំបំផុតបានភ្លាមៗ ពោលគឺលោកអ្នកអាចធ្វើការជួញដូរទៅលើភាគហ៊ុន សន្ទស្សន៍ តម្លៃវត្ថុធាតុដើម ព្រមទាំងបម្រែបម្រួលតម្លៃរូបិយប័ណ្ណ។ ទាំងអស់នេះអាចធ្វើការជួញដូរបានក្នុងកម្មវិធីតែមួយ។ មិនចាំបាច់មានទ្រព្យក្នុងដៃ ព្រមទាំងអាចរកផលចំណេញបានពីរជម្រើស អ្នកអាចលក់ទ្រព្យសម្បត្តិដោយមិនចាំបាច់មានកម្មសិទ្ធិ។ ដោយមិនចាំបាច់ទិញមាស អ្នកក៏អាចលក់មាសបានដែរ។ លក្ខណៈពិសេសនេះគឺជាហេតុផលដែល CFDs គឺជាទីផ្សារដ៏ល្អសម្រាប់ធ្វើពាណិជ្ជកម្ម។ នេះមានន័យថា លោកអ្នកក៏អាចទទួលបានប្រាក់ចំណេញពីទីផ្សារកើនឡើង និងទីផ្សារធ្លាក់ចុះផងដែរ។ ងាយស្រួលក្នុងការធ្វើប្រតិបត្តិការ និងការប្រើប្រាស់សន្ទនីយភាព លោកអ្នកអាចធ្វើការជួញដូរតាមបែប CFDs បានចាប់ពីប្រាក់ 500 USD ហើយអាចជួញដូរបានក្នុងរយៈពេល 24 ម៉ោងនិង 5 ថ្ងៃក្នុងមួយសប្តាហ៍។ លើសពីនេះ លោកអ្នកក៏អាចប្រើប្រាស់ “សន្ទនីយភាព” ដែលជួយបំពោងប្រាក់របស់លោកអ្នកកាន់តែធំជាងមុន។ ឧទាហរណ៍ អ្នកមាន 1000 ដុល្លារ ដូច្នេះការប្រើសន្ទនីយភាពចំនួន 100: 1 នឹងអនុញ្ញាតឱ្យអ្នកធ្វើប្រតិបត្តិការរហូតដល់ 100,000 ដុល្លារ។ ងាយស្រួលដាក់លើគណនីជួញដូរនៅ STMarket ដាក់ស្នើឯកសារពាក់ព័ន្ធមួយចំនួនទៅកាន់ឈ្នួលជើងសារឧបករណ៍និស្សន្ទរបស់យើងដើម្បីផ្ទៀងផ្ទាត់ និងអនុម័ត ផ្តល់មូលនិធិដល់គណនីជួញដូររបស់អ្នក ហើយអ្នកអាចចាប់ផ្តើមដំណើរជួញដូររបស់អ្នកជាមួយ STMarket បានហើយ។ (English Version) Why do you need a CFD trading account? Have you ever wondered how to access the global financial markets without owning the underlying assets? A CFD (Contract for Difference) trading account provides a solution. Here are the reasons why Convenient accessing the global financial market Technology makes our lives much easier, and it enables you to access the largest financial market in an instant, from stocks and indices to commodities and currencies, all from a single platform. Do not have to own the underlying and work in a two-way market You can sell assets without owning them. Without actually purchasing gold, you can also sell gold. This feature is the reason why CFDs are a good market to trade. This means that you can also profit from both rising and falling markets. Accessibility and the use of leverage Trading CFDs can be started with as little as 500 USD and is available 24 hours, 5 days per week. This is known as “leverage” which helps to gain exposure to larger positions with a smaller initial investment. For instance, you have 1000 USD, so using the leverage of 100:1 would let you make transactions up to 100,000 USD. Easy to onboard a trading account at STMarket Submit a few relevant documents for our derivatives representatives to verify and approve, fund your trading account, and you are set to begin your trading journey with STMarket.

Understanding about Unemployment Rate
⭐️ គន្លឹះសំខាន់– អត្រាគ្មានការងារធ្វើនៅសហរដ្ឋអាមេរិក (Unemployment rate) គឺជាសូចនាករដែលវាស់វែងពីភាគរយនៃកម្លាំងការងារសរុបដោយរាប់បញ្ចូលទាំងអ្នកគ្មានការងារធ្វើ និងអ្នកកំពុងស្វែងរកការងារនៅក្នុងអំឡុងខែមុន។– ភាគច្រើនអត្រាគ្មានការងារធ្វើ (Unemployment rate) ត្រូវបានប្រើប្រាស់ដោយសេដ្ឋកិច្ចវិទូ ក្នុងគោលបំណងដើម្បីយល់ដឹងពីស្ថានភាពទីផ្សារការងារ ក៏ដូចជាដំណើរការនៃសេដ្ឋកិច្ចទាំងមូល។– ៣ ជំហានសាមញ្ញៗ ដើម្បីប្រើប្រាស់សូចនាករនេះឱ្យមានប្រសិទ្ធភាព។– អត្រាគ្មានការងារធ្វើ (The Unemployment Rate) គឺជាប្រភេទសូចនាករសេដ្ឋកិច្ចមួយដែលគេយកទៅវាយតម្លៃលើស្ថានភាពទីផ្សារការងារ ហើយវិនិយោគិនក៏គួរតែពិចារណាលើសូចនាករផ្សេងទៀតដូចជា អត្រាការចូលរួមកម្លាំងពលកម្ម (The Labor Force Participation Rate)ដើម្បីទទួលបានការយល់ដឹងឱ្យកាន់តែច្បាស់មួយកម្រិតទៀត។ ⭐️ តើអត្រាគ្មានការងារធ្វើរបស់សហរដ្ឋអាមេរិក (Unemployment rate) គឺជាអ្វី?អត្រាគ្មានការងារធ្វើនៅសហរដ្ឋអាមេរិក (Unemployment rate) គឺជាសូចនាករដែលវាស់វែងពីភាគរយនៃកម្លាំងការងារសរុបដោយរាប់បញ្ចូលទាំងអ្នកគ្មានការងារធ្វើ និងអ្នកកំពុងស្វែងរកការងារនៅក្នុងអំឡុងខែមុន។ វាត្រូវបានចេញផ្សាយជារៀងរាល់ខែនៅថ្ងៃសុក្រនៃសប្តាហ៍ទី១ ហើយត្រូវបានរៀបចំឡើងដោយការិយាល័យស្ថិតិការងាររបស់ក្រសួងការងារសហរដ្ឋអាមេរិក (US Bureau of Labor Statistics) ។ ⭐️ យល់ដឹងបន្ថែមអំពីអត្រាគ្មានការងារធ្វើ (Unemployment rate)ភាគច្រើនអត្រាគ្មានការងារធ្វើ (Unemployment rate) ត្រូវបានប្រើប្រាស់ដោយសេដ្ឋកិច្ចវិទូ ក្នុងគោលបំណងដើម្បីយល់ដឹងពីស្ថានភាពទីផ្សារការងារ ក៏ដូចជាដំណើរការនៃសេដ្ឋកិច្ចទាំងមូល។ ម៉្យាងវិញទៀត គេក៏អាចប្រើវាដើម្បីកំណត់គោលនយោបាយរូបិយវត្ថុ និងធ្វើការសម្រេចចិត្តទៅតាមយុទ្ធសាស្ត្រដែលបានកំណត់ផងដែរ។ ⭐️ ៣ ជំហានសាមញ្ញៗ ដើម្បីប្រើប្រាស់សូចនាករនេះឱ្យមានប្រសិទ្ធភាព១. ពិនិត្យមើលកាលវិភាគដែលបានចេញផ្សាយនៅលើគេហទំព័រ BLS ដើម្បីស្វែងរករបាយការណ៍ប្រចាំខែ។ ២. ពិនិត្យមើលអត្រាភាគរយគ្មានការងារធ្វើ ហើយប្រៀបធៀបទិន្នន័យជាក់ស្តែងទៅនឹងទិន្នន័យរំពឹងទុក។ ប្រសិនបើទិន្នន័យជាក់ស្តែងមានកម្រិតទាបជាងទិន្នន័យរំពឹងទុក វានឹងបង្ហាញពីសញ្ញាវិជ្ជមាននៃតម្លៃប្រាក់ដុល្លារអាមេរិក(USD) ភាពរឹងមាំនៃសេដ្ឋកិច្ច និងអាចទាក់ទាញការវិនិយោគរបស់បរទេសបានផងដែរ។ តម្លៃប្រាក់ដុល្លារអាមេរិក(USD) ក៏អាចឡើងថ្លៃបើធៀបទៅនឹងតម្លៃរូបិយប័ណ្ណផ្សេងទៀត។ ៣. វិភាគទៅលើទិន្នន័យផ្សេងៗបន្ថែមទៀត ដើម្បីយល់ដឹងកាន់តែច្បាស់អំពីស្ថានភាពបច្ចុប្បន្ននៃទីផ្សារការងារ ក៏ដូចជាចំនួនការងារដែលបានបង្កើតឡើង ឬបាត់បង់ អត្រាចូលរួមនៃកម្លាំងពលកម្ម (The Labor Force Participation Rate) និងព័ត៌មានប្រជាសាស្រ្តផ្សេងទៀត(Demographic Information)។ សរុបសេចក្តីមកអត្រាគ្មានការងារធ្វើ (The Unemployment Rate) គឺជាប្រភេទសូចនាករសេដ្ឋកិច្ចមួយដែលគេយកទៅវាយតម្លៃលើស្ថានភាពទីផ្សារការងារ ហើយវិនិយោគិនក៏គួរតែពិចារណាលើសូចនាករផ្សេងទៀតដូចជា អត្រាការចូលរួមកម្លាំងពលកម្ម (The Labor Force Participation Rate)ដើម្បីទទួលបានការយល់ដឹងឱ្យកាន់តែច្បាស់មួយកម្រិតទៀត។ ត្រូវចាំថា ប្រសិនបើសេដ្ឋកិច្ចមានភាពទន់ខ្សោយ និងចំនួនការងារមានការថយចុះនោះ អត្រាគ្មានការងារធ្វើ (Unemployment Rate)នឹងអាចកើនឡើង។ | English Version |⭐️ Key takeaway– The US Unemployment Rate measures the percentage of the total workforce that was unemployed and actively seeking employment during the previous month.– The unemployment rate is widely used by economists and policymakers to gain valuable insights into overall labor market conditions and the performance of the economy.– 3 simple steps to effectively use this indicator.– The unemployment rate is one of the economic indicators used to assess the health of the labor market, but it is essential to consider other indicators such as the labor force participation rate to gain a better insight. ⭐️ What is the US Unemployment rate? The US Unemployment Rate measures the percentage of the total workforce that was unemployed and actively seeking employment during the previous month. It is released on the first Friday of every month and prepared by the US Bureau of Labor Statistics (BLS). ⭐️ Further insight into the unemployment rate The unemployment rate is widely used by economists and policymakers to gain valuable insights into overall labor market conditions and the performance of the economy. This indicator can assist in setting monetary policy and making strategic economic decisions. ⭐️ 3 simple steps to effectively use this indicator1. Check the release schedule on the BLS website to access the monthly report. 2. Look at the headline number of the unemployment rate percentage and compare actual data with expected readings. A lower-than-expected reading indicates a positive sign for the USD, a stronger economy, and may attract foreign investment. As a result, the USD may appreciate against other currencies. And vice versa. 3. Analyze additional data to better understand the current state of the job market, such as the number of jobs created or lost, the labor force participation rate, and other demographic information. ⭐️ Bottom lineThe unemployment rate is one of the economic indicators used to assess the health of the labor market, but it is essential to consider other indicators such as the labor force participation rate to gain a better insight. Keep in mind that in a weak economy and with a shortage of jobs, the unemployment rate can be expected to rise.

Understanding about Gross Domestic Product
⭐️ គន្លឹះសំខាន់– ផលិតផលក្នុងស្រុកសរុប ឬអាចសរសេរកាត់ថា ផសស (ជាភាសាអង់គ្លេស៖ Gross Domestic Product, GDP) គឺជារង្វាស់រូបិយវត្ថុឬទ្រព្យសម្បត្តិនៃទំនិញនិងសេវាកម្មទាំងអស់ក្នុងតម្លៃទីផ្សារដែលផលិតឡើងនៅអំឡុងពេលជាក់លាក់ណាមួយ។– ផលិតផលក្នុងស្រុកសរុបត្រូវបានចេញផ្សាយចំនួន៣លើកក្នុងមួយត្រីមាសដែលរួមមាន៖ ទិន្នន័យលើកទី១ (Advance) ទិន្នន័យលើកទី២ (Second) និងទិន្នន័យលើកទី៣ (Third)។– ការរំពឹងទុករបស់ទីផ្សារទៅលើសូចនាករ GDP។– សូចនាករCCI បានធ្លាក់ចុះដល់ ១០១.៣ នៅក្នុងខែមីនា ដែលមានន័យថាទំនុកចិត្តរបស់ប្រជាជនសហរដ្ឋអាមេរិកទៅលើសេដ្ឋកិច្ចទាំងមូលមានការធ្លាក់ចុះ។ ⭐️ ឈ្វេងយល់ពីផលិតផលក្នុងស្រុកសរុប(GDP)ផលិតផលក្នុងស្រុកសរុប ត្រូវបានប្រើប្រាស់ដើម្បីស្ទាបស្ទង់ទៅលើស្ថានភាពសេដ្ឋកិច្ច ដោយធ្វើការវាស់វែងទៅលើតម្លៃទីផ្សាររបស់ទំនិញ និងសេវាកម្មក្នុងស្រុកសរុបនៅក្នុងរយៈពេលកំណត់មួយ។ គោលបំណងចម្បងគឺជួយប្រាប់ពីទិសដៅក៏ដូចជាស្ថានភាពសេដ្ឋកិច្ច ទៅដល់សេដ្ឋកិច្ចវិទូ វិនិយោគិន ឬអាជីវករ ដើម្បីធ្វើការសម្រេចចិត្តទៅលើគោលនយោបាយសេដ្ឋកិច្ច ផ្តល់ឱកាសក្នុងការវិនិយោគ និងប្រាប់ពីលំហូរទីផ្សារបច្ចុប្បន្ន។ *** ផលិតផលក្នុងស្រុកសរុបត្រូវបានចេញផ្សាយចំនួន៣លើកក្នុងមួយត្រីមាសដែលរួមមាន៖ ទិន្នន័យលើកទី១ (Advance) ទិន្នន័យលើកទី២ (Second) និងទិន្នន័យលើកទី៣ (Third)។ ⭐️ រូបមន្តGDP = ការចាយវាយប្រចាំថ្ងៃរបស់ប្រជាពលរដ្ឋ +ការវិនិយោគ +ការចំណាយរបស់រដ្ឋ + (ផលិតផលនាំចេញ – ផលិតផលនាំចូល) ⭐️ យល់ដឹងបន្ថែមអំពីសូចនាករ GDPការកើនឡើង ឬការថយចុះនៃផលិតផលក្នុងស្រុកសរុបនេះ អាចជះឥទ្ធិពលទៅដល់កត្តាជាច្រើនដូចជា៖ ⭐️ ការរំពឹងទុករបស់ទីផ្សារទៅលើសូចនាករ GDPអ្នកវិភាគជាច្រើនបានរំពឹងទុកថា ការចេញផ្សាយទិន្នន័យ GDP របស់សហរដ្ឋអាមេរិកក្នុងខែនេះនឹងថយចុះដល់ ២.០% នៅក្នុងត្រីមាសទីមួយ បន្ទាប់ពីមានការធ្លាក់ចុះ ២.៦% នៅក្នុងត្រីមាសពីមុន។ នេះបានជំរុញឱ្យមានការព្រួយបារម្ភយ៉ាងខ្លាំងអំពីការធ្លាក់ចុះនៃសេដ្ឋកិច្ច និងអាចធ្វើឱ្យប្រាក់ដុល្លារក្នុងស្រុកធ្លាក់ចុះក្នុងរយៈពេលខ្លី។ ចំណែកឯសូចនាករផ្សេងទៀតដូចជា សូចនាករ CCI និងការនាំចេញផលិតផលក្នុងស្រុកក៏អាចជំរុញឱ្យមានការធ្លាក់ចុះនៃ GDP ផងដែរ។ ⭐️ ផលិតផលក្នុងស្រុកសរុបរបស់សហរដ្ឋអាមេរិកនៅត្រីមាសទី១ ជាក់ស្តែង ព្យាករណ៍ ទិន្នន័យចាស់ ខែមេសា – ២.០% ២.៦% ខែមីនា ២.៦% ២.៧% ៣.២% ⭐️ កត្តាមួយចំនួនដែលធ្វើឱ្យសូចនាករ GDP មានការធ្លាក់ចុះសូចនាករ CCI បានធ្លាក់ចុះដល់ ១០១.៣ នៅក្នុងខែមីនា ដែលមានន័យថាទំនុកចិត្តរបស់ប្រជាជនសហរដ្ឋអាមេរិកទៅលើសេដ្ឋកិច្ចទាំងមូលមានការធ្លាក់ចុះ។ នេះបានធ្វើឱ្យមានផលប៉ះពាល់ដល់ការចាយវាយប្រចាំថ្ងៃរបស់ប្រជាពលរដ្ឋ ព្រមទាំងផលិតភាពរបស់សេដ្ឋកិច្ច (Economy’s productivity) ជាពិសេសទៅលើតម្រូវការ និងការផ្គត់ផ្គង់។ ចំណែកឯការនាំចេញផលិតផលក្នុងស្រុកក៏មានការថយចុះដល់ ២.៧%ផងដែរ។ កត្តាទាំងនេះបានញុាំងឱ្យមានការធ្លាក់ចុះនៃ GDP ដោយសារតែការចាយវាយប្រចាំថ្ងៃរបស់ប្រជាពលរដ្ឋ និងការនាំចេញផលិតផលក្នុងស្រុកដែលជាផ្នែកមួយនៅក្នុងការគណនារក GDP។ ដូច្នេះ វិនិយោគិនគួរតែត្រួតពិនិត្យទៅលើព័ត៌មាន ព្រមទាំងសូចនាករសេដ្ឋកិច្ចផ្សេងទៀត ដើម្បីទទួលបានការយល់ដឹងកាន់តែច្បាស់ទៅលើស្ថានភាពសេដ្ឋកិច្ច។ ⭐️ នេះគឺជាផលិតផលក្នុងស្រុកសរុប (GDP) របស់បណ្តាប្រទេសធំក្នុងរយៈពេល២ឆ្នាំរួមមាន៖– US GDP (7% Q4 2021 Vs. -1.6% Q1 2022)– Japan GDP (1.1% Q3 2022 Vs. -0.3% Q4 2022)– UK GDP (5.5% Q2 2021 Vs. -0.3% Q3 2022)– New Zealand GDP (17.4% Q2 2021 Vs. -0.3% Q3 2021)– Canada GDP (1.6% Q4 2021 Vs. 0.0% Q4 2022) | English Version | ⭐️ Key Takeaways– Gross domestic product (GDP) is a monetary measure of the market value of all the final goods and services produced in a specific time period by a country or countries.– Remember, there are 3 versions of GDP released monthly: advance, second release, and third release.– The market expectation for the U.S. GDP.– The consumer confidence index fell to 101.3 in March may affect consumer spending and the economy’s productivity, especially supply and demand dynamics. ⭐️ Understand about GDPThe important indicator, gross domestic product, is used to assess how well the economy is doing by measuring the market value of domestic goods and services over a period of time. This aims to guide policymakers, investors, or businesses to make decisions about economic policies, investment opportunities, and market trends. *** Remember, there are 3 versions of GDP released monthly: advance, second release, and third release. ⭐️ FormulaGDP = Consumer spending + Investment + Government spending + (Export-Import). ⭐️ Further InsightsThe increase or decrease in GDP may influence other factors such as: ⭐️ The market expectation for the U.S. GDPMany analysts expect the U.S. GDP data release this month to surge to 2.0% in the first quarter, down from 2.6% in the previous quarter. If the forecast is confirmed, then this may raise concerns about the economic slowdown and weaken the domestic dollar temporarily. Other indicators, such as the CCI and exports, can also provide insights into the health of the economy and may help explain a decline in GDP. ⭐️ U.S. GDP Q1 Advance Actual Forecast Previous April – 2.0% 2.6% March 2.6% 2.7% 3.2% ⭐️ The explanation for a decline in GDPThe consumer confidence index fell to 101.3 in March, which may affect consumer spending and the economy’s productivity, especially supply and demand dynamics. The same effect was applied by the decline in exports, which dropped by 2.7%. This may further cause the GDP to slip a bit as the GDP’s component is made up of consumer spending and net exports. Therefore, it is important to monitor other potential news and indicators to gain a comprehensive understanding of the state of the economy. ⭐️ In a span of 2 years, the GDP for the major countries is listed below from peak to the lowest point:– US GDP (7% Q4 2021 Vs. -1.6% Q1 2022)– Japan GDP (1.1% Q3 2022 Vs. -0.3% Q4 2022)– UK GDP (5.5% Q2 2021 Vs. -0.3% Q3 2022)– New Zealand GDP (17.4% Q2 2021 Vs. -0.3% Q3 2021)– Canada GDP (1.6% Q4 2021 Vs. 0.0% Q4 2022)
Understanding the Consumer Price Index
ឈ្វេងយល់ពី CPI សន្ទស្សន៍ថ្លៃទំនិញប្រើប្រាស់(Consumer Price Index)ត្រូវបានគេប្រើប្រាស់ ដើម្បីវាស់ស្ទង់ពីបម្រែបម្រួលតម្លៃទំនិញប្រចាំខែដែលរួមបញ្ចូលទាំងតម្លៃទំនិញនិងសេវាកម្មនាំចូល។ គោលបំណងចម្បងរបស់វាគឺ វាស់ស្ទង់អតិផរណាឬបរិត្តផរណានៅក្នុងសេដ្ឋកិច្ច ប៉ុន្តែវាក៏ត្រូវបានប្រើប្រាស់ក្នុងការសម្របសម្រួលដល់ការចាយវាយរបស់ប្រជាពលរដ្ឋ តាមរយៈការកែប្រែប្រភពចំណូល-ចំណាយរបស់ពួកគេ។ យល់ដឹងបន្ថែមអំពីCPI ប្រសិនបើ CPIមានកម្រិតខ្ពស់ នោះវានឹងបង្ហាញថាអត្រាការប្រាក់មានការកើនឡើងដោយសារការរឹតបន្តឹងគោលនយោបាយរបស់ធនាគារកណ្តាល ដើម្បីទប់ទល់នឹងសម្ពាធអតិផរណាដែលបានកើនឡើង។ ម៉្យាងវិញទៀត វាក៏អាចធ្វើឱ្យតម្លៃរូបិយប័ណ្ណក្នុងស្រុកកាន់តែរឹងមាំផងដែរ។ ផ្ទុយទៅវិញ ប្រសិនបើCPI មានកម្រិតទាបនោះ វាបង្ហាញពីការថយចុះរបស់អត្រាការប្រាក់ ចំណែកឯតម្លៃរូបិយប័ណ្ណក្នុងស្រុកក៏មានភាពទន់ខ្សោយដូចគ្នា។ ហេតុអ្វីបានជា CPI មានសារៈសំខាន់ចំពោះវិនិយោគិន? CPI មានសារៈសំខាន់យ៉ាងខ្លាំងសម្រាប់វិនិយោគិនទាំងអស់ ដែលអាចឱ្យពួកគេយល់ដឹងអំពីសម្ពាធអតិផរណានៅក្នុងសេដ្ឋកិច្ចឱ្យកាន់តែស៊ីជម្រៅ ហើយពួកគេក៏អាចយកទៅប្រើប្រាស់ ដើម្បីធ្វើការសម្រេចចិត្តឱ្យបានត្រឹមត្រូវ និងកែតម្រូវយុទ្ធសាស្រ្តជួញដូររបស់ពួកគេឱ្យកាន់តែប្រសើរឡើងនៅពេលដែលទិន្នន័យត្រូវបានចេញផ្សាយ។ ទស្សនវិស័យទីផ្សារ យោងតាមរបាយការណ៍ស្ថិតិរបស់ការិយាល័យការងារ(BLS) នៅក្នុងខែមីនា US CPI MoM បានធ្លាក់ចុះមកត្រឹម ០.១ ភាគរយបើធៀបទៅនឹងទិន្នន័យនៅក្នុងខែកុម្ភៈគឺមានចំនួន ០.៤ ភាគរយ ហើយសម្រាប់ US Core CPI ដែលមិនរាប់បញ្ចូលអាហារ និងថាមពលបានធ្លាក់ចុះមកត្រឹម ០.៤ ភាគរយ និង ៥.៦ភាគរយ ដែលជាទិន្នន័យប្រចាំឆ្នាំ។ CPIប្រចាំខែរបស់សហរដ្ឋអាមេរិក (US CPI MoM) ជាក់ស្តែង ព្យាករណ៍ ទិន្នន័យចាស់ ខែមីនា ០.១% ០.២% ០.៤% ខែកុម្ភៈ ០.៤% ០.៤% ០.៥% ទិន្នន័យនេះ បានបង្ហាញពីភាពវិជ្ជមានសម្រាប់សេដ្ឋកិច្ចអាមេរិក ដោយសារអតិផរណាមានការថយចុះបន្តិចម្តងៗដែលអាចធ្វើឱ្យកម្រិតអត្រាការប្រាក់ត្រូវបានកាត់បន្ថយ។ នេះបានញាំុងឱ្យទំនុកចិត្តក្នុងចាយវាយលើការប្រើប្រាស់របស់ប្រជាពលរដ្ឋមានភាពប្រសើរឡើងវិញ។ ទោះជាយ៉ាងណាក៏ដោយ អ្នកវិភាគជាច្រើននៅតែរងចាំសង្កេតមើលលើអតិផរណា ដោយសារតែអត្រាគ្មានការងារធ្វើ (Unemployment rate)បានធ្លាក់ចុះ ០.១ ភាគរយដែលអាចជំរុញឱ្យប្រាក់ឈ្នួល និងតម្លៃទំនិញមានការកើនឡើង។ ដូច្នេះតើអត្រារបស់ Fed នៅក្នុងកិច្ចប្រជុំបន្ទាប់អាចនឹងកើនឡើងឬធ្លាក់ចុះ? (English Version) Understand about CPI The Consumer Price Index (CPI) is used to measure the monthly changes in price from the consumer’s consumption, including imports of goods and services. Its primary purpose is to measure inflation and deflation in the economy, but it is also used to adjust income and expenditure streams by governments in order to keep up with the cost of living. Further Insights The higher CPI can signal an increase in interest rates by the central bank to combat upward inflationary pressure, which can lead to a stronger value of the domestic currency. Conversely, a lower CPI can lower interest rates and result in a weaker currency. Why is the CPI important to traders? The CPI is very crucial to traders regarding deeper insights into inflationary pressures in the economy, which can be used to make informed decisions and adjust their trading strategies when the data is released. Market Outlook According to the Bureau of Labor Statistics report, the US consumer price index (MoM) in March declined to 0.1 percent from 0.4 percent in February. And the core CPI, which excludes food and energy, fell to 0.4 percent and 5.6 percent on an annual basis. Consumer Price Index (MoM) Actual Forecast Previous March 0.1% 0.2% 0.4% February 0.4% 0.4% 0.5% This a positive sign for US Economy This can be seen as a positive sign for the US economy as inflation is slowly reducing and there is more confidence in consumption due to the low interest rate. However, many analysts are still keeping inflation in check as the recent data released shows the unemployment rate fell by 0.1 percent, which can push wages and prices up. So will the Fed rate in the next meeting go up or down?

Understanding about Retail Sales
⭐️ គន្លឹះសំខាន់– សារៈសំខាន់នៃ Retail Sales– កត្តាដែលជះឥទ្ធិពលលើ Retail Sales– ឥទ្ធិពលនៃ Retail Sales– ទិន្នន័យចេញផ្សាយថ្មីៗ ⭐️ ឈ្វេងយល់ពីទិន្នន័យ Retail SalesRetail Sales សំដៅទៅលើការលក់ទំនិញ និងសេវាកម្មសម្រេចដោយផ្ទាល់ទៅកាន់អ្នកប្រើប្រាស់ជាទូទៅ រួមមានទំនិញ និងសេវាកម្មសម្រាប់ប្រើប្រាស់ផ្ទាល់ខ្លួន ឬក្នុងគ្រួសារ។ ⭐️ តើទិន្នន័យ Retail Sales តែងតែចេញផ្សាយនៅពេលណា?ទិន្នន័យនេះតែងតែចេញផ្សាយនារាល់សប្តាហ៍ទី២ នៅម៉ោង១៩:៣០ (ម៉ោងនៅក្នុងព្រះរាជាណាចក្រកម្ពុជា) រាល់ខែ ហើយទិន្នន័យ Retail Sales របស់ខែកក្កដា នឹងចេញផ្សាយនៅខែសីហាជានិច្ច។ ⭐️ សារៈសំខាន់នៃរបាយការណ៍ទិន្នន័យ Retail Salesរបាយការណ៍ទិន្នន័យ Retail Sales គឺជាសូចនាករចង្អុលបង្ហាញពីសុខភាពសេដ្ឋកិច្ចដ៏សំខាន់ ព្រោះវាអាចសបញ្ជាក់ឱ្យយើងយល់ពីការចំណាយនៃអ្នកប្រើប្រាស់នានា។ ទិន្នន័យនេះត្រូវបានអាជីវករ អ្នកវិនិយោគគិន និងធនាគារកណ្តាលប្រើប្រាស់ជាសូចនាករសំខាន់មុនធ្វើការសម្រេចចិត្តណាមួយ។ 👉 វដ្តអាជីវកម្ម៖ ការផ្លាស់ប្តូរនៃរបាយការណ៍ទិន្នន័យ Retail Sales ជាសញ្ញាណបញ្ជាក់ពីស្ថានភាពបច្ចុប្បន្ននៃវដ្តអាជីវកម្ម។ អាជីវករនានាតែងតែតាមដានទិន្នន័យនេះមុនធ្វើការសម្រេចចិត្តសំខាន់ៗណាមួយ។ 👉 ទីផ្សារ Forex និង ទីផ្សារភាគហ៊ុន៖ ទិន្នន័យ Retail Sales ក៏អាចជះឥទ្ធិពលដល់និន្នាការទីផ្សារភាគហ៊ុន និងទីផ្សារ Forex ផងដែរ។ ទិន្នន័យ Retail Sales ខ្ពស់គឺជាដំណឹងល្អសម្រាប់ម្ចាស់ភាគហ៊ុននៃក្រុមហ៊ុនលក់រាយ ពីព្រោះ វាមានន័យថាប្រាក់ចំណូលក្រុមហ៊ុនអាចនឹងកើនឡើងខ្ពស់ ។ ដូចនេះ តួលេខ Retail Sales ខ្ពស់ ទូទៅតែងតែធ្វើឱ្យមាននិន្នាការវិជ្ជមាននៅក្នុងផ្សារភាគហ៊ុន និងទីផ្សារ Forex ។ 👉គោលនយោបាយរូបិយវត្ថុ៖ ទិន្នន័យ Retail Sales ក៏អាចជះឥទ្ធិពលដល់ការសម្រេចចិត្តរបស់ធនាគារកណ្តាលដែរ។ ធនាគារកណ្តាលប្រើទិន្នន័យ Retail Sales ដើម្បីវាយតម្លៃសុខភាពសេដ្ឋកិច្ច និងជួយធនាគារកណ្តាលក្នុងការសម្រេចចិត្តក្នុងការចេញគោលនយោបាយរូបិយប័ណ្ណណាមួយដូចជាការបង្កើនអត្រាការប្រាក់ជាដើម ។ ⭐️ កត្តាដែលជះឥទ្ធិពលលើទិន្នន័យ Retail Salesកត្តាដែលជះឥទ្ធិពលលើ Retail Sales អាចប្រែប្រួលអាស្រ័យលើលក្ខខណ្ឌសេដ្ឋកិច្ច និងលក្ខខណ្ឌទីផ្សារផ្សេងៗ។ តែទោះជាយ៉ាងណាក៏ដោយ មានកត្តាទូទៅមួយចំនួនដែលអាចប៉ះពាល់ដល់ Retail Sales រួមមាន ទំនុកចិត្តរបស់អ្នកប្រើប្រាស់ អតិផរណា ស្ថានភាពសេដ្ឋកិច្ចបច្ចុប្បន្ន និងនិន្នាការផ្សេងៗជាដើម។ ⭐️ ឥទ្ធិពលនៃទិន្នន័យ Retail Sales– បើ Retail Sales កើនឡើង នោះវាឆ្លុះបញ្ចាំងពីការរំពឹងទុកនៃអត្រាការប្រាក់ខ្ពស់ ដែលនាំឱ្យមានការពង្រឹងនៃកម្លាំងរូបិយប័ណ្ណក្នុងស្រុក ព្រមទាំងការបង្កើននូវទំនុកចិត្តរបស់អ្នកវិនិយោគនានា។– បើ Retail Sales ចុះក្រោម នោះវាឆ្លុះបញ្ចាំងពីការរំពឹងទុកនៃអត្រាការប្រាក់ទាប ដែលនាំឱ្យមានការចុះខ្សោយនៃកម្លាំងរូបិយប័ណ្ណក្នុងស្រុក ព្រមទាំងបន្ថយនូវទំនុកចិត្តរបស់អ្នកវិនិយោគនានា។ ⭐️ ទិន្នន័យចេញផ្សាយថ្មីៗRetail Sales: 3.0% ( ខែមករា ឆ្នាំ២០២៣) – 0.2% (ខែមិថុនា ឆ្នាំ២០២៣) | English Version |⭐️ Key takeaway– The Importance of Retail Sales– Factors that influence this indicator– The impact of Retail Sales– Recent release data ⭐️ Understand about Retail SalesRetail Sales is the sales of finished goods and services by businesses directly to consumers, usually for personal or household consumption. ⭐️ When is the Retail Sales data release?This data often releases on the second week at 19:30 (hours in the Cambodia) every month, and July’s Retail Sales data will always be released in August. ⭐️ The Importance of Retail SalesThe Retail Sale data report is an indicator of important economic health because it can help us understand customer consumption. This data is used by businesses, investors, and central banks as important indicators prior to making any decision. 👉 Business cycle: changes in RS can offer after clues about the current state of the business cycle, helping policymakers and investors make more informed decisions. 👉 Forex and stock market: RS data can influence stock market trends and inform investment decisions, as strong sales may boost company revenues and share prices. 👉 Monetary policy: The Federal Reserve uses retail sales data to assess the health of the economy and guide monetary policy decisions, such as interest rate adjustments. ⭐️ Factors that influence this indicatorFactors affecting Retail Sales may vary depending on economic conditions and various market conditions. However, some of the factors that could affect Retail Sales include consumer confidence, inflation, current economic conditions and other various trends. ⭐️ The impact of Retail Sales– If Retail Sales increases, it reflects expectations of higher interest rates, leading to a strengthening of domestic currency as well as increasing investor confidence.– If Retail Sales goes down, it reflects the expectations of friendly rates, leading to a weakening of local currency and reducing investor confidence. ⭐️ Recent updatesRetail Sales: 3.0% (January 2023) – 0.2% (June 2013)
Understanding the U.S. Dollar Index
⭐️ គន្លឹះសំខាន់– សន្ទស្សន៍ប្រាក់ដុល្លារអាមេរិក គឺជារង្វាស់នៃតម្លៃប្រាក់ដុល្លារអាមេរិក ដែលទាក់ទងនឹងកញ្ចប់រូបិយប័ណ្ណបរទេស។– សន្ទស្សន៍ប្រាក់ដុល្លារអាមេរិកត្រូវបានផ្សំដោយរូបិយប័ណ្ណបរទេសចំនួន ៦។– របៀបក្នុងការមើលទិន្នន័យសន្ទស្សន៍ប្រាក់ដុល្លារអាមេរិក– កត្តាដែលមានឥទ្ធិពលលើសន្ទស្សន៍ប្រាក់ដុល្លារអាមេរិក– គុណសម្បត្តិ និងគុណវិបត្តិនៃសន្ទស្សន៍ប្រាក់ដុល្លារអាមេរិក ⭐️ ឈ្វេងយល់ពីទិន្នន័យ U.S. Dollar Indexសន្ទស្សន៍ប្រាក់ដុល្លារអាមេរិក គឺជារង្វាស់នៃតម្លៃប្រាក់ដុល្លារអាមេរិក ដែលទាក់ទងនឹងកញ្ចប់រូបិយប័ណ្ណបរទេស។ USDX ត្រូវបានបង្កើតឡើងដោយ Federal Reserve របស់សហរដ្ឋអាមេរិកក្នុងឆ្នាំ 1973។ ⭐️ តើសន្ទស្សន៍ប្រាក់ដុល្លារអាមេរិកត្រូវបានផ្សំដោយរូបិយប័ណ្ណបរទេសណាខ្លះ?សន្ទស្សន៍ប្រាក់ដុល្លារអាមេរិកត្រូវបានផ្សំដោយរូបិយប័ណ្ណបរទេសចំនួន ៦ ដូចជា៖– ប្រាក់អឺរ៉ូ (EUR)– ប្រាក់យ៉េន (JPY)– ផោន (GBP)– ដុល្លារកាណាដា (CAD)– ក្រោន (SEK)– ហ្វ្រង់(CHF) ⭐️ របៀបក្នុងការមើលទិន្នន័យសន្ទស្សន៍ប្រាក់ដុល្លារអាមេរិកUSDX វាស់តម្លៃទូទៅរបស់ប្រាក់ដុល្លារដែលទាក់ទងទៅនឹងមូលដ្ឋាននៃ 100 ។ក. នៅពេលដែលតម្លៃប្រាក់ដុល្លារអាមេរិកឡើងថ្លៃ៖ឧបមាថា តម្លៃបច្ចុប្បន្នគឺ 130 ដែលមានន័យថាប្រាក់ដុល្លារបានកើនឡើង 30% ចាប់តាំងពីការចាប់ផ្តើមសន្ទស្សន៍លើកដំបូង (130-100=30)។ប្រាក់ដុល្លារអាមេរិកបានឡើងថ្លៃ 30% ធៀបនឹងកញ្ចប់រូបិយប័ណ្ណ។ និយាយឱ្យសាមញ្ញ តម្លៃប្រាក់ដុល្លារឡើងថ្លៃ បើប្រៀបធៀបទៅនឹងរូបិយប័ណ្ណផ្សេងទៀត។ ខ. នៅពេលដែលតម្លៃប្រាក់ដុល្លារអាមេរិកចុះថ្លៃ៖ឧបមាថា តម្លៃបច្ចុប្បន្នគឺ 86 ដែលមានន័យថាប្រាក់ដុល្លារបានចុះថ្លៃ 14% ចាប់តាំងពីការចាប់ផ្តើមសន្ទស្សន៍លើកដំបូង (86-100= -14 )។ប្រាក់ដុល្លារអាមេរិកបានចុះថ្លៃ 14% ធៀបនឹងកញ្ចប់រូបិយប័ណ្ណ។ និយាយឱ្យសាមញ្ញ តម្លៃប្រាក់ដុល្លារចុះថ្លៃ បើប្រៀបធៀបទៅនឹងរូបិយប័ណ្ណផ្សេងទៀត។ ⭐️ កត្តាដែលមានឥទ្ធិពលលើសន្ទស្សន៍ប្រាក់ដុល្លារអាមេរិកសន្ទស្សន៍ប្រាក់ដុល្លារអាមេរិកត្រូវបានរងផលប៉ះពាល់ដោយកត្តាម៉ាក្រូសេដ្ឋកិច្ច ដែលរួមមានអតិផរណា ឬបរិត្តផរណានៃរូបិយប័ណ្ណបរទេសដែលរួមបញ្ចូលក្នុងកញ្ចប់រូបិយប័ណ្ណប្រៀបធៀប ក៏ដូចជាការធ្លាក់ចុះនៃសេដ្ឋកិច្ច និងកំណើនសេដ្ឋកិច្ចនៅក្នុងប្រទេសទាំងនោះ។ ⭐️ គុណសម្បត្តិ និងគុណវិបត្តិនៃសន្ទស្សន៍ប្រាក់ដុល្លារអាមេរិកប្រាក់ដុល្លារអាមេរិកផ្តល់អត្ថប្រយោជន៍មួយចំនួន ប៉ុន្តែក៏មានផលអវិជ្ជមានមួយចំនួនផងដែរ។ក. គុណសម្បត្តិនៃប្រាក់ដុល្លារឡើងថ្លៃ៖ការនាំចូលមានតម្លៃថោកជាង៖ ទំនិញដែលផលិតនៅបរទេស ដែលនាំចូលទៅសហរដ្ឋអាមេរិកនឹងមានតម្លៃថោកជាង ប្រសិនបើរូបិយប័ណ្ណរបស់អ្នកផលិតធ្លាក់ថ្លៃធៀបនឹងប្រាក់ដុល្លារ។ក្រុមហ៊ុនចម្រុះជាតិសាសន៍ដែលធ្វើអាជីវកម្មនៅសហរដ្ឋអាមេរិកនឹងទទួលបានអត្ថប្រយោជន៍ពីប្រាក់ដុល្លារដែលឡើងថ្លៃនោះ។ខ. គុណវិបត្តិនៃប្រាក់ដុល្លារឡើងថ្លៃ៖ផលលំបាកនៃអ្នកនាំចេញ៖ ការនាំចេញមានតម្លៃថោក ហើយទំនិញផលិតក្នុងស្រុកថ្លៃជាងនៅបរទេស។ ឧទាហរណ៍៖ ប្រសិនបើសហរដ្ឋអាមេរិកនាំចូលរថយន្តពីប្រទេសបារាំង ដែលមានតម្លៃ €60,000 ក្នុងមួយគ្រឿង ជាមួយនឹងអត្រាប្តូរប្រាក់ $1.35 ក្នុងមួយអឺរ៉ូ នោះរថយន្តនឹងមានតម្លៃ $81,000 ក្នុងមួយគ្រឿង។ ផ្ទុយមកវិញ ប្រសិនបើអត្រាប្តូរប្រាក់ធ្លាក់ចុះមកត្រឹម $1.15 ក្នុងមួយអឺរ៉ូ នោះលក់រថយន្តនឹងមានតម្លៃ $69,000 ក្នុងមួយគ្រឿង ។ដូច្នេះ ប្រសិនបើប្រាក់ដុល្លារបន្តការឡើងថ្លៃ នោះតម្លៃនាំចូលនឹងបន្តធ្លាក់ចុះ។ ម្យ៉ាងវិញទៀត បើយើងសន្មតថាកត្តាសេដ្ឋកិច្ចមានស្ថិរភាពដូចគ្នាហើយតម្លៃប្រាក់ដុល្លារអាមេរិកឡើងថ្លៃ នោះក្រុមហ៊ុនអាមេរិកដែលនាំចូលវត្ថុធាតុដើមពីបរទេសនឹងមានការចំណាយសរុបទាបសម្រាប់ថ្លៃផលិតកម្ម និងទទួលបានប្រាក់ចំណេញកាន់តែខ្ពស់។ ⭐️ ទិន្នន័យចេញផ្សាយថ្មីៗU.S. Dollar Index (DXY): 102.17 (1 សីហា 2023) | English Version | ⭐️ Key takeaway– The U.S. dollar index (USD) is a measure of the value of the U.S. dollar relative to a basket of foreign currencies.– The US Dollar Index consists of six foreign currencies.– How to read U.S. Dollar Index (USDX)?– Factors that influence this indicator.Advantages and disadvantages of the U.S. Dollar Index ⭐️ Understanding U.S. Dollar IndexThe U.S. dollar index (USD) is a measure of the value of the U.S. dollar relative to a basket of foreign currencies. The USDX was established by the U.S. Federal Reserve in 1973 ⭐️ What currencies are in the USDX Basket?The US Dollar Index consists of six foreign currencies.They are:– Euro (EUR)– Japanese Yen (JPY)– British Pound (GBP)– Canadian Dollar (CAD)– Swedish Krona (SEK)– Swiss Franc (CHF) ⭐️ How to read U.S. Dollar Index (USDX)?USDX measures the dollar’s general value relative to a base of 100.A. Appreciated ValueCurrent reading says 130, which means the dollar has risen 30% since the start of the index. (130-100=30)The US dollar has appreciated 30% versus the basket of currencies over the time period. Simply put, if the USD goes up, that means the U.S. dollar is gaining strength or value when compared to the other currencies. B. Depreciated ValueCurrent reading says 86, which means the dollar has fallen 14% since the start of the index. (86-100=-14 )The US dollar has depreciated 14% versus the basket of currencies over the time period. Simply put, if the USD goes down, that means the U.S. dollar is weakening when compared to the other currencies. ⭐️ Factors that influence this indicatorThe U.S dollar index is affected by macroeconomic factors, which include inflation or deflation in the dollar foreign currencies included in the comparable basket, as well as recessions and economic growth in those countries. ⭐️ Advantages and disadvantages of the U.S. Dollar IndexThe U.S. Dollar benefits some but negatively impacts others.A. Advantages of a strong DollarImports are cheaper: goods produced abroad and imported to the United States will be cheaper if the manufacturer’s currency falls in value compared to the dollar.Multinationals that do business in the U.S. will benefit from a strengthening dollar.B. Disadvantages of a strong DollarExporters suffer: just as imports become cheaper at home, domestically produced goods become relatively more expensive abroad. Example: If US imports cars from France, and the cost is €60,000 per car with an exchange rate of $1.35 per euro, then it will cost $81,000 per car. The same car selling for the same amount of euro would cost $69,000 if the exchange rate fell to $1.15 per euro.So, if the dollar continues its strengthening trend, import prices will likely keep falling. Assuming the same steady economic factor, U.S. companies that import raw materials from abroad will have a lower total cost of production and enjoy a larger profit margin. ⭐️ Recent updatesU.S. Dollar Index (DXY): 102.17 (1st August 2023)

Understanding the Balance of Trade
⭐️ គន្លឹះសំខាន់– ជញ្ជីងពាណិជ្ជកម្ម (BOT) គឺជាធាតុផ្សំសំខាន់នៃសមតុល្យនៃការទូទាត់របស់ប្រទេសមួយ។– BOT មានបីប្រភេទគឺ អតិរេកពាណិជ្ជកម្ម ឱនភាពពាណិជ្ជកម្ម និងតុល្យភាពពាណិជ្ជកម្ម។– របាយការណ៍ BOT ជាធម្មតាត្រូវបានបង្កើតដោយភ្នាក់ងាររដ្ឋាភិបាលដែលទទួលខុសត្រូវលើការជួញដូរ និងការធ្វើពាណិជ្ជកម្ម។– របាយការណ៍ BOT ជាធម្មតាត្រូវបានចេញផ្សាយជារៀងរាល់ខែ។– សារៈសំខាន់នៃ BOT– កត្តាដែលជះឥទ្ធិពលលើ BOT។– ឥទ្ធិពលនៃ BOT ⭐️ ឈ្វេងយល់ពីទិន្នន័យ Trade Balanceតើអ្វីទៅជាជញ្ជីងពាណិជ្ជកម្ម (Balance of Trade)?ជញ្ជីងពាណិជ្ជកម្ម (BOT) គឺជាសូចនាករសេដ្ឋកិច្ចដែលតាមដានពីភាពខុសគ្នារវាងតម្លៃនៃការនាំចេញ និងការនាំចូលទំនិញរបស់ប្រទេសក្នុងរយៈពេលជាក់លាក់ណាមួយ ដែលជាធម្មតាក្នុងមួយឆ្នាំ។ ប្រភេទនៃ Balance of Trade៖– អតិរេកពាណិជ្ជកម្ម (Trade surplus): នៅពេលដែលប្រទេសមួយនាំចេញទំនិញ និងសេវាកម្មច្រើនជាងការនាំចូល ប្រទេសនោះមានអតិរេកពាណិជ្ជកម្ម។– ឱនភាពពាណិជ្ជកម្ម (Trade deficit): នៅពេលដែលប្រទេសមួយនាំចូលលើសពីការនាំចេញ ប្រទេសនោះមានឱនភាពពាណិជ្ជកម្ម។– តុល្យភាពពាណិជ្ជកម្ម (Balanced trade): តុល្យភាពពាណិជ្ជកម្មកើតឡើងនៅពេលដែលតម្លៃនៃការនាំចេញស្មើនឹងតម្លៃនៃការនាំចូល។ ដូច្នេះ ប្រទេសដែលមានអតិរេកពាណិជ្ជកម្ម ជាទូទៅត្រូវបានគេមើលឃើញថាកំពុងស្ថិតក្នុងស្ថានភាពសេដ្ឋកិច្ចរឹងមាំ ដោយសារប្រទេសនេះទទួលបានប្រាក់ចំណូលពិការនាំចេញច្រើនជាងការនាំចូល ដែលនាំឱ្យមានកំណើនសេដ្ឋកិច្ច ដោយសារតែមានការវិនិយោគច្រើន ក៏ដូចជាមានតម្រូវការពលកម្មច្រើនផងដែរ។⭐️ តើរបាយការណ៍ Balance of Trade ចេញផ្សាយដោយនរណា?របាយការណ៍ Balance of Trade ជាធម្មតាត្រូវបានចេញផ្សាយដោយភ្នាក់ងាររដ្ឋាភិបាលដែលទទួលខុសត្រូវលើការជួញដូរ និងការធ្វើពាណិជ្ជកម្ម។ ទីភ្នាក់ងារទាំងនេះចងក្រង និងវិភាគទិន្នន័យពីសេចក្តីប្រកាសគយ កំណត់ត្រាកំពង់ផែ ការស្ទង់មតិអាជីវកម្ម និងប្រភពពាក់ព័ន្ធផ្សេងទៀត ដើម្បីផលិតរបាយការណ៍ Balance of Trade ត្រឹមត្រូវ និងអាចទុកចិត្តបាន។ ⭐️ តើទិន្នន័យ Balance of Trade តែងតែចេញផ្សាយនៅពេលណា?របាយការណ៍ Balance of Trade ជាធម្មតាត្រូវបានចេញផ្សាយជារៀងរាល់ខែ ក្នុងរយៈពេលពីរទៅបីសប្តាហ៍បន្ទាប់ពីការបញ្ចប់រយៈពេលរាយការណ៍។របាយការណ៍ Balance of Trade ជាធម្មតាមានចេញផ្សាយនៅលើគេហទំព័ររបស់ទីភ្នាក់ងាររដ្ឋាភិបាលនៃប្រទេសនីមួយៗ ដែលអាចផ្តល់ភាពងាយស្រួលដល់នរណាម្នាក់ដែលចាប់អារម្មណ៍លើទិន្នន័យទាំងនោះ។ ⭐️ សារៈសំខាន់នៃរបាយការណ៍ទិន្នន័យ Trade BalanceBOT មានសារៈសំខាន់ណាស់ព្រោះ៖-BOT ផ្តល់ការយល់ដឹងអំពីសុខភាពសេដ្ឋកិច្ចរបស់ប្រទេសមួយ។-BOT អាចជះឥទ្ធិពលដល់តម្លៃរូបិយប័ណ្ណរបស់ប្រទេសមួយ។-BOT អាចជះឥទ្ធិពលដល់កម្រិតការងាររបស់ប្រទេសមួយ។ ⭐️ ឥទ្ធិពលនៃទិន្នន័យ Balance of TradeBalance of Trade ត្រូវបានជះឥទ្ធិពលដោយកត្តាទាំងឡាយណាដែលប៉ះពាល់ដល់ពាណិជ្ជកម្មអន្តរជាតិ។ កត្តាទាំងនោះរួមមានកត្តាអំណោយផល (ចំនួនដី កម្លាំងពលកម្ម ដើមទុន) និងផលិតភាព គោលនយោបាយពាណិជ្ជកម្ម អត្រាប្តូរប្រាក់ ទុនបម្រុងរូបិយប័ណ្ណបរទេស អតិផរណា និងតម្រូវការផ្សេងៗជាដើម។ ⭐️ ទិន្នន័យចេញផ្សាយថ្មីៗU.S. Balance of Trade: -68.98 USD Billion (ឧសភា 2023) | English Version |⭐️ Key takeaway– Balance of Trade is a key component of a country’s balance of payment.– There are three types of BOT which are trade surplus, trade deficit, and balanced trade.– The balance of trade report is typically generated by government agencies responsible for trade and commerce.– Balance of Trade reports are usually released on a monthly basis.– The importance of Balance of Trade– Factors that influence this indicator– The impact of Trade Balance ⭐️ Understanding Trade BalanceWhat is Balance of Trade?The balance of trade (BOT) is a key component of a country’s balance of payments and is an economic indicator that tracks the difference between the value of a country’s exports and imports of goods over a specific period, usually a year. It is sometimes referred to as the trade balance. Types of Balance of Trade:– Trade surplus: when a country exports more goods and services than it imports, it has a trade surplus.– Trade deficit: when a country imports more than it exports, it has a trade deficit.– Balanced trade: occurs when the value of exports equals the value of imports. So, a country with a trade surplus is generally seen as being in a strong economic position, as it is earning more from its export than its import. This can lead to increased economic growth, as businesses have more money to invest and hire new workers.⭐️ Who publishes the Balance of Trade report?The Balance of Trade report is typically generated by government agencies responsible for trade and commerce. These agencies compile and analyze data from customs declarations, port records, surveys of businesses, and other relevant sources to produce an accurate and reliable trade balance report. ⭐️The Importance of Balance of TradeBOT is important because:-BOT provides insights into a country’s economic health.-BOT can affect a country’s currency value.-BOT can affect a country’s employment levels. ⭐️ The impact of Balance of TradeBalance of Trade is influenced by all the factors that affect the international trades. These include factor endowments (amount of land, labor, capital) and productivity, trade policy, exchange rates, foreign currency reserves, inflation, and demand. ⭐️ Recent updatesU.S. Balance of Trade: -68.98 USD Billion (May 2023)