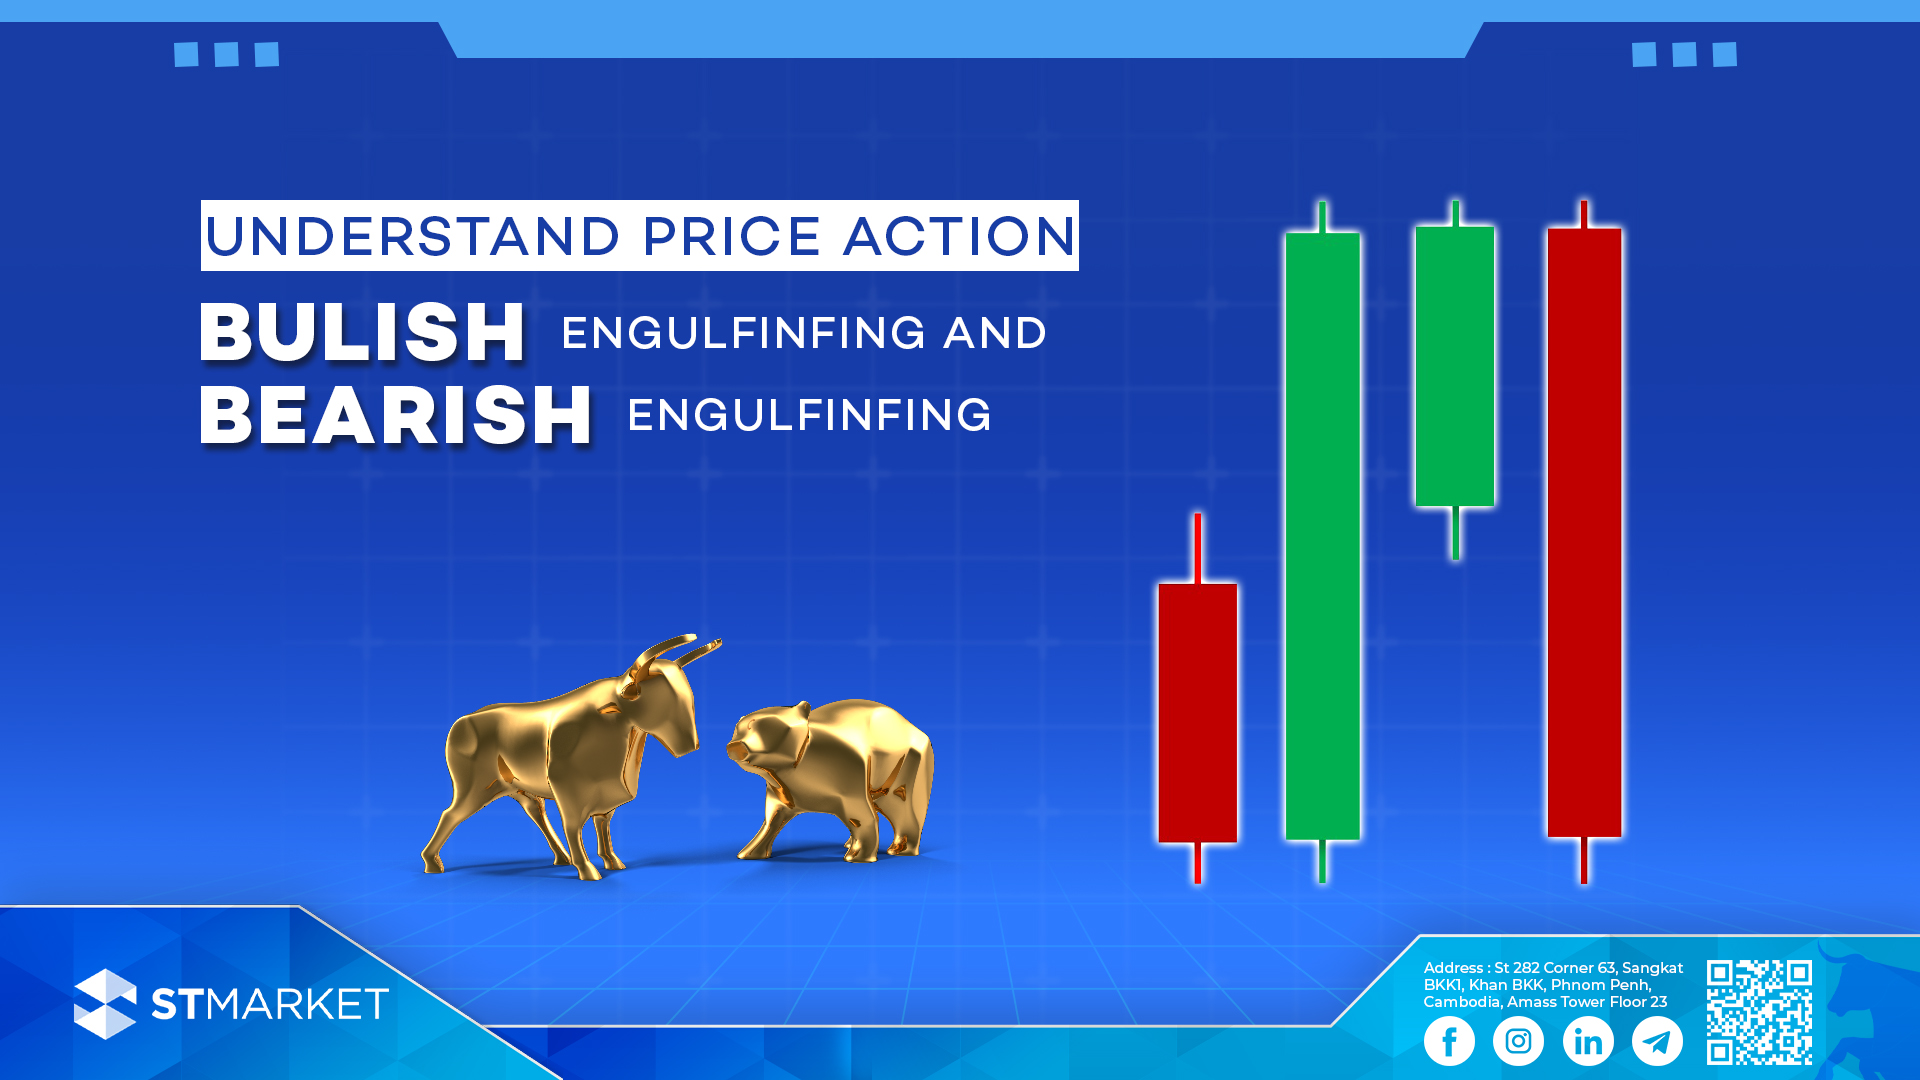
Bullish Engulfing and Bearish Engulfing អ្វីទៅជា Bullish Engulfing? និយមន័យ ទម្រង់ Bullish Engulfing គឺជាសញ្ញានៃការប្តូរទិសពីលំហូរចុះមកឡើងវិញ ដែលភាគច្រើនវាបង្ហាញនៅចុងនៃលំហូរចុះ។ រូបរាង លក្ខណៈសម្គាល់ គំរូ Bullish Engulfingមាន២ខេនដល ដែលខេនដលទីមួយពណ៌ក្រហម(តម្លៃបិទទាបជាងតម្លៃបើកផ្សារ) និង ខេនដលទី២ ពណ៌បៃតង(តម្លៃបិទផ្សារខ្ពស់ជាងតម្លៃបើកផ្សារ) ដែលខេនដលទី២ក្តោមពីលើខេនដលទី១ វាបង្ហាញថាអ្នកទិញចូលមកគ្រប់គ្រងនៅក្នុងទីផ្សារ។ នៅក្នុងលំហូរចុះតម្លៃព្យាយាមបុកបំបែកទៅតំបន់ដែលទាបជាងមុន ប៉ុន្តែវាបានបង្កើតជាទម្រង់ Bullish Engulfing វាជាសញ្ញានៃកាវិលត្រឡប់នៃលំហូរចុះ។ ឧទារហរណ៍ នៅខាងចុងនៃលំហូចុះ បង្កើតបានជាទម្រង់ Bullish Engulfing ទម្រង់ Bullish engulfing ត្រូវបានបង្កើតឡើងនៅពេលដែលទីផ្សារបើកមកនៅទាបជាងតម្លៃបិទកាលពីម្សិលមិញប៉ុន្តែអ្នកទិញក៏បានឃើញអ្នកទិញចូលមកក្នុងទីផ្សារហើយរុញតម្លៃអោយឡើងទៅលើ ហើយបិទនៅលើតម្លៃបើកកាលពីម្សិលមិញ។ ទម្រង់ Bullish Engulfing កំណត់ប្រាប់យើងថាមានការផ្លាស់ប្តូរ ពីសន្ទស្សន៍អារម្មណ៍របស់អ្នកលក់ទៅជាមានសន្ទស្សន្ទអារម្មណ៍អ្នកទិញចូលមកគ្រប់គ្រងទីផ្សារ ហើយវាជាពេលវេលាល្អក្នុងការរកឱកាសដើម្បីរកតម្លៃចូលទិញ។ យោងតាមការសិក្សាអំពី “Technical Analysis and Candlestick Patterns” ដែលធ្វើឡើងដោយ សកលវិទ្យាល័យនៃ Michiganនៅក្នុងឆ្នាំ 2018 ទម្រង់engulfing pattern មានអត្រាជោគជ័យប្រហែល 65% ក្នុងការព្យាករណ៍ថាតម្លៃនៅពេលខាងមុនហ្នឹងមានការកើនឡើង។ ការសិក្សានេះគូសបញ្ជាក់អំពីប្រសិទ្ធភាពនៃការប្រើប្រាស់ប្រវត្តិទិន្នន័យតម្លៃ និងទម្រង់ខេនដល ដូចជាទម្រង់ bullish engulfing ដើម្បីវាស់ស្ទង់អារម្មណ៍ទីផ្សារ និងធ្វើការសម្រេចចិត្តក្នុងការជួញដូរដែលមានប្រសិទ្ធភាពជាងមុន។ អ្វីទៅជា Bearish Engulfing? និយមន័យ គំរូ Bearish Engulfing គឺជាសញ្ញានៃការផ្លាស់ប្តូរទិសរបស់លំហូរឡើង ដែលភាគច្រើនវាបង្ហាញនៅចុងនៃលំហូរឡើង។ រូបរាង លក្ខណៈសម្គាល់ គំរូ Bearish Engulfing មាន២ខេនដល ដែល ខេនដលទីមួយពណ៌បៃតង(តម្លៃបិទផ្សារខ្ពស់ជាងតម្លៃបើកផ្សារ) និង ខេនដលទី២ពណ៌ក្រហម(តម្លៃបិទទាបជាងតម្លៃបើកផ្សារ) ដែលខេនដលទី២ក្តោមពីលើខេនដលទី១ វាបង្ហាញថាអ្នកលក់ចូលមកគ្រប់គ្រងទីផ្សារ។ នៅក្នុងលំហូរឡើង ទីផ្សារបានព្យាយាមបុកបំបែកទៅតំបន់ដែលខ្ពស់ជាងមុន ប៉ុន្តែវាបានបង្កើតជាទម្រង់ Bearish Engulfing នេះជាសញ្ញានៃកាវិលត្រឡប់នៃលំហូរ។ ឧទារហរណ៍ នៅខាងចុងនៃលំហូរឡើងវាបង្កើតបានជាទម្រង់ Bearish Engulfing ទម្រង់ Bearish Engulfing មានខេនដលពីរ៖ ទីមួយគឺជាខេនដលដែលមានសន្ទុះតូចជាង ហើយទីពីរគឺជាខេនដលដែលមានទំហំធំជាងដែលគ្រប់ដណ្តប់ពេញតួនៃទៀនទីមួយ។ ការបង្កើតនេះបង្ហាញពីការផ្លាស់ប្តូរសន្ទុះពីអ្នកទិញទៅអ្នកលក់។ យោងតាមការសិក្សាដែលធ្វើឡើងដោយ Technical Analysis Research & Education (TARE) Foundation ដែលបានបោះពុម្ពផ្សាយនៅក្នុងរបាយការណ៍របស់ពួកគេដែលមានចំណងជើងថា “Analyzing the Efficacy of Candlestick Patterns in Modern Markets,” ទម្រង់ Bearish Engulfing មានអត្រាជោគជ័យប្រហែល 72% ក្នុងការព្យាករណ៍ថាហ្នឹងមានការប្តូរទិសពីឡើងមកចុះ។ (English Version) What is the Bullish Engulfing Pattern? Definition A Bullish Engulfing pattern is a bullish reversal pattern that typically appears at the end of a downtrend. Appearance Characteristics The Bullish Engulfing pattern contains two candlesticks, the first candlestick is bearish, andthe second candlestick is bullish engulfing the first candlestick, indicating buyer take control in the market. During a downtrend, prices attempt to break into lower regions, but the formation of a Bullish Engulfing pattern signals a potential reversal. Example Look for the pattern at the end of a downtrend, where a larger bullish candle engulfs the previous bearish candle. The bullish engulfing candlestick pattern is formed when the market opens lower than the previous day’s close, but then buyers step in and push the price higher, closing above the previous day’s open. The bullish engulfing candlestick pattern marks a clear transition from bearish to bullish market sentiment and an opportunity to take long positions. According to the “Technical Analysis and Candlestick Patterns” study conducted by the University of Michigan in 2018, the bullish engulfing pattern has a success rate of approximately 65% in predicting future price increases. This study underscores the effectiveness of using historical price data and candlestick patterns, such as the bullish engulfing pattern, to gauge market sentiment and make informed trading decisions. What is the Bearish Engulfing Pattern? Definition A Bearish Engulfing pattern is a bearish reversal pattern that typically appears at the end of an uptrend. Appearance Characteristics The Bearish Engulfing pattern contains two candlestick, first candlestick is bullish and second candlestick is bearish engulfs the first candlestick indicates a shift from buyer control to seller control. During an uptrend, prices attempt to break into higher regions, but the formation of a Bearish Engulfing pattern signals a potential reversal. Example: Look for the pattern at the end of an uptrend, where a larger bearish candle engulfs the previous bullish candle. The Bearish Engulfing pattern consists of two candles: the first is a smaller bullish candle, and the second is a larger bearish candle that completely engulfs the body of the first candle. This formation suggests a shift in momentum from buyers to sellers. According to a study conducted by the Technical Analysis Research & Education (TARE) Foundation, published in their report titled “Analyzing the Efficacy of Candlestick Patterns in Modern Markets,” the bearish engulfing pattern has a success rate of approximately 72% in predicting bearish reversals.
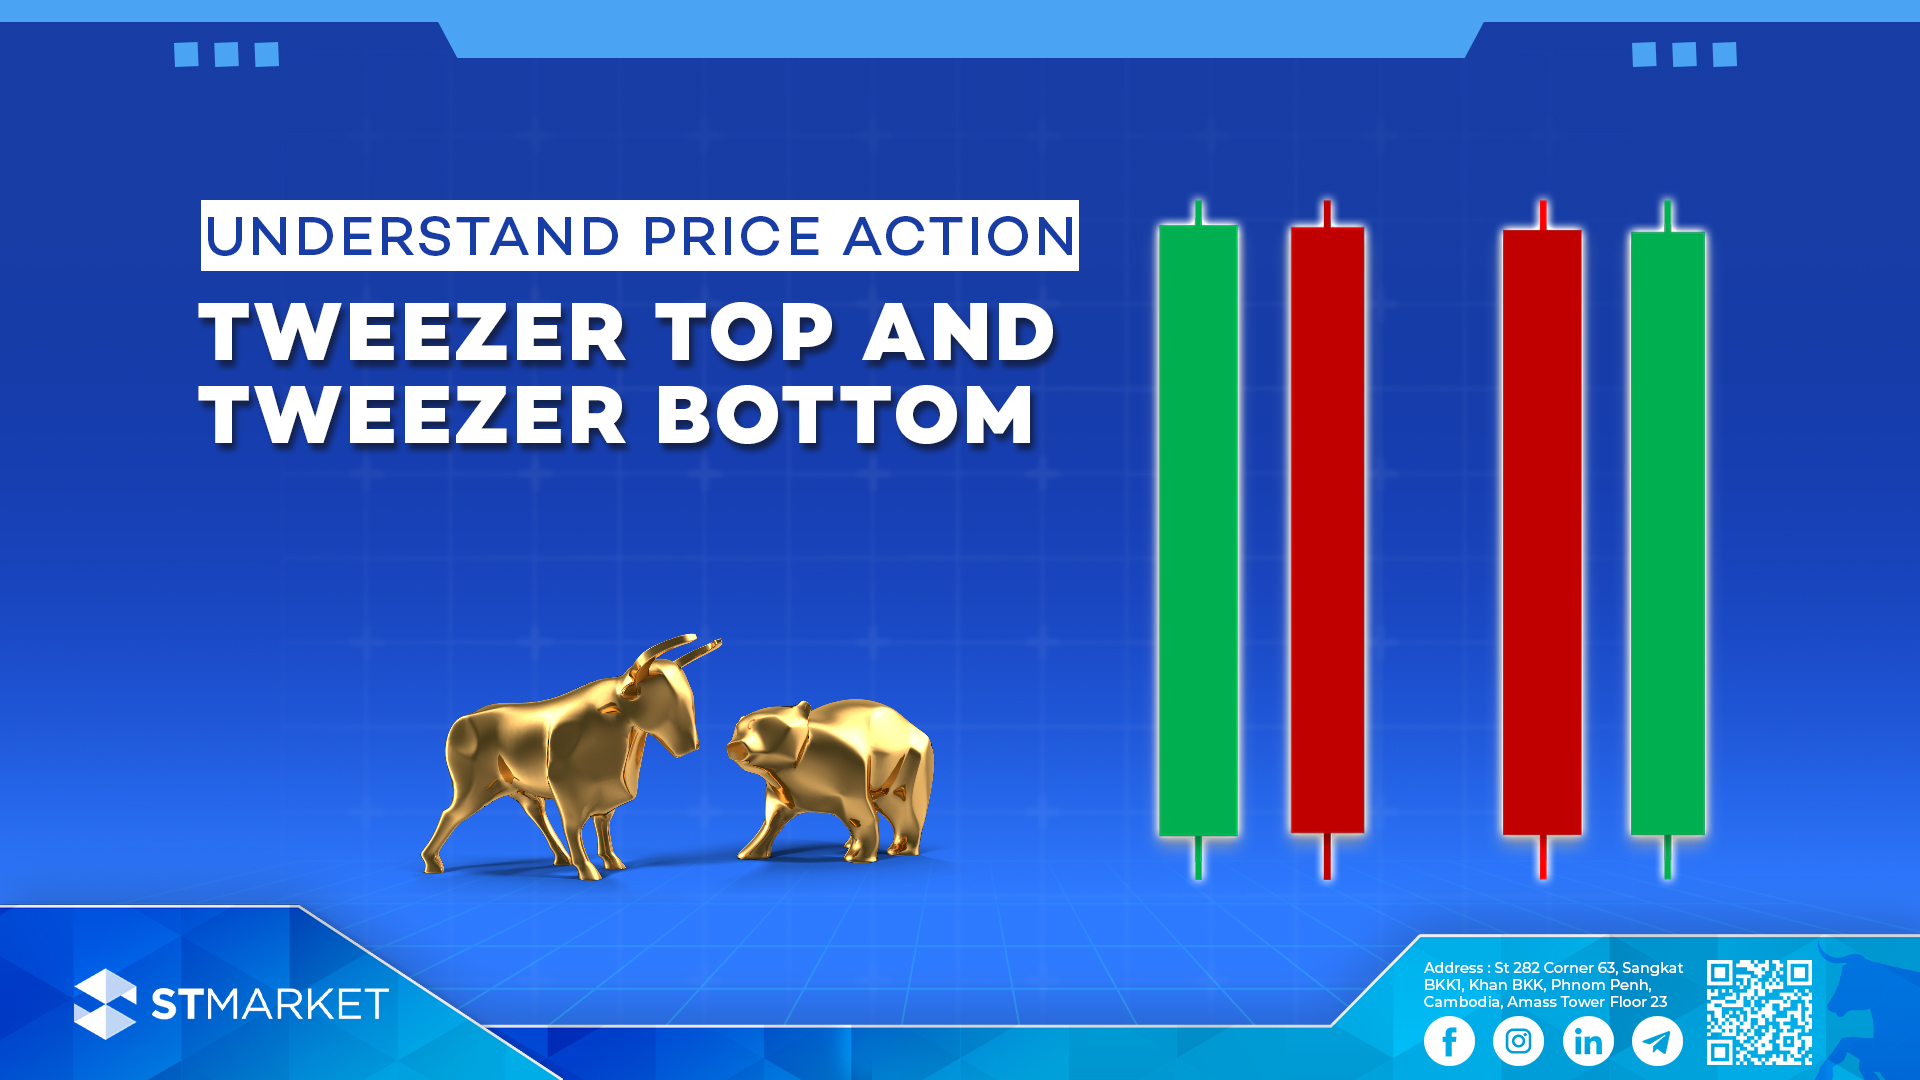
Understand Tweezer Top and Tweezer Bottom អ្វីទៅជា Tweezer Top? និយមន័យ Tweezer Top គឺជាសញ្ញាវិលត្រឡប់នៃលំហូរចុះ វាបង្ហាញភាគច្រើននៅចុងនៃលំហូរឡើង។ រូបរាង លក្ខណៈសម្គាល់ ទម្រង់ Tweezer Top តម្លៃព្យាយាមបុកបំបែកទៅតំបន់ដែលខ្ពស់ជាងមុន ប៉ុន្តែវាបង្កើតបានជាទម្រង់ Tweezer Top ដែលនេះជាសញ្ញានៃកាវិលត្រឡប់នៃលំហូរ។ ការកំណត់ Tweezer Top នៅលើតារាង នៅខាងចុងនៃលំហូរឡើង វាបង្កើតបានជាទម្រង់ Tweezer Top អ្វីទៅជា Tweezer Bottom? និយមន័យ ទម្រង់Tweezer Bottom គឺជាសញ្ញានៃកាវិលត្រឡប់នៃលំហូរឡើង វាបង្ហាញភាគច្រើននៅចុងនៃលំហូរចុះ។ រូបរាង លក្ខណៈសម្គាល់ គំរូ Tweezer Bottom នៅក្នុងលំហូរចុះ តម្លៃព្យាយាមបុកបំបែកទៅតំបន់ដែលទាបជាងមុន ប៉ុន្តែវាបង្កើតបានជា ទម្រង់ Tweezer Bottom នេះជាសញ្ញាបង្ហាញថា កាវិលត្រឡប់នៃលំហូរចុះអាចកើតមាន ។ ការកំណត់ Tweezer Bottom នៅលើផ្ទាំងតម្លៃ នៅខាងចុងនៃលំហូរចុះ វាងបង្កើតបានជា ទម្រង់ Tweezer Bottom ការគ្រប់គ្រងហានិភ័យ ពិនិត្យមើលការសម្រេចចិត្តទិញលក់របស់អ្នកអោយបានច្បាស់លាស់។ ប្រើទំហំសមស្របនិងគ្រប់គ្រងការទិញលក់ដោយប្រើ stop-loss ដើម្បីការពារទ្រព្យសម្បត្តិរបស់អ្នក។ សេចក្តីសន្និដ្ឋាន ការយល់ដឹងនិងកំណត់អត្តសញ្ញាណ Tweezer Top, និង Tweezer Bottom អាចធ្វើឱ្យយុទ្ធសាស្រ្តទិញលក់របស់អ្នកប្រសើរឡើង។ គំរូទាំងនេះផ្តល់នូវការយល់ដឹងអំពីការបញ្ច្រាសទីផ្សារសក្តានុពល ប៉ុន្តែត្រូវបានប្រើប្រាស់ជាមួយឧបករណ៍វិភាគបច្ចេកទេសផ្សេងទៀតនិងការគ្រប់គ្រងហានិភ័យ។ What is the Tweezer Top Pattern? Definition A Tweezer Top pattern is a bearish reversal pattern that typically appears at the end of an uptrend. Appearance Characteristics The Tweezer Top pattern indicates that prices attempted to break into higher regions but formed a Tweezer Top, signaling a potential reversal. Identifying a Tweezer Top on a Chart Look for the pattern at the end of an uptrend, where two or more candles have matching highs. What is the Tweezer Bottom Pattern? Definition A Tweezer Bottom pattern is a bullish reversal pattern that typically appears at the end of a downtrend. Appearance Characteristics The Tweezer Bottom pattern indicates that prices attempted to break into lower regions but formed a Tweezer Bottom, signaling a potential reversal. Identifying a Tweezer Bottom on a Chart Look for the pattern at the end of a downtrend, where two or more candles have matching lows. Risk Management Assess your trading decisions carefully. Use appropriate position sizing and manage trades using stop-loss orders to protect your capital. Conclusion Understanding and correctly identifying Tweezer Top, and Tweezer Bottom patterns can greatly enhance your trading strategy. These patterns provide valuable insights into potential market reversals, but they should be used in conjunction with other technical analysis tools and risk management practices.
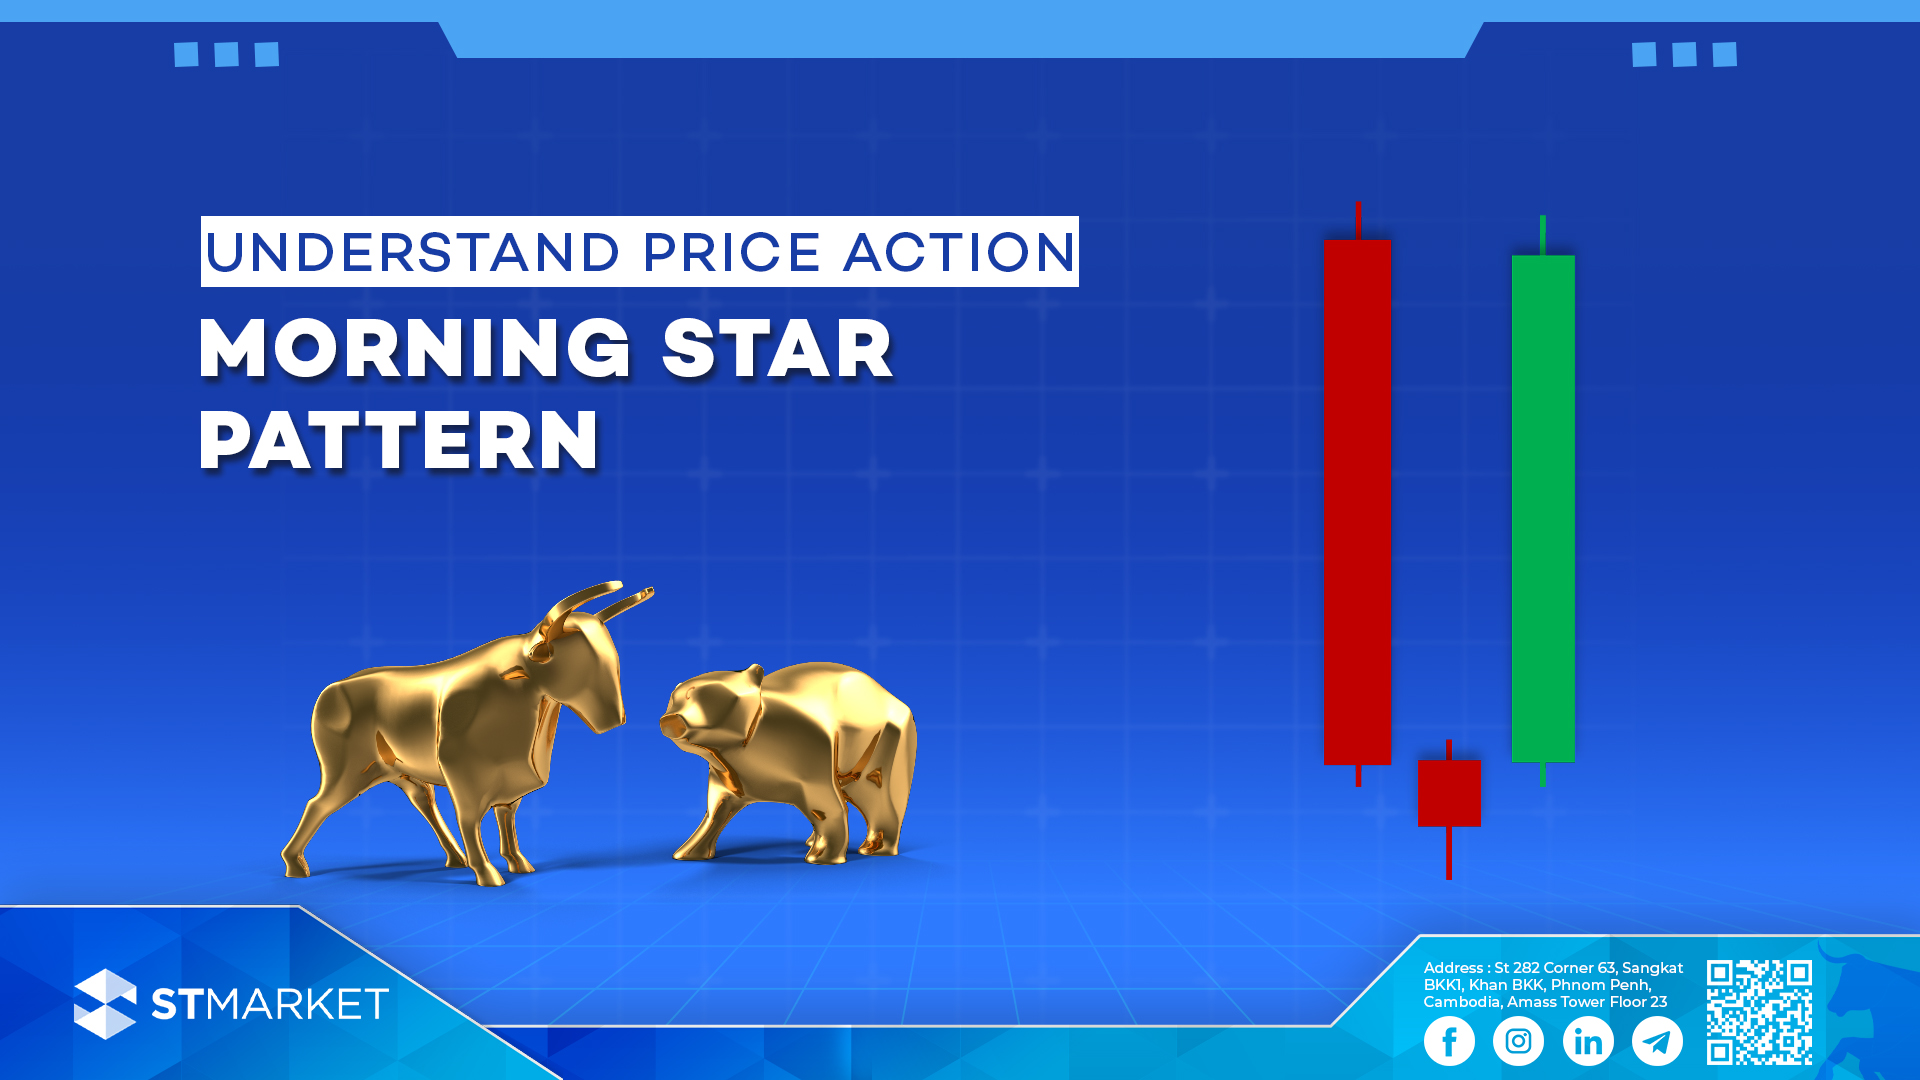
Understand Morning Star Pattern អ្វីទៅជា Morning Star Pattern? និយមន័យ Morning Star Pattern គឺជាសញ្ញាវិលត្រឡប់នៃលំហូរចុះ វាបង្ហាញភាគច្រើននៅចុងនៃលំហូរចុះ។ រូបរាង លក្ខណៈសម្គាល់ Morning Star Pattern គឺជាទម្រង់នៃការវិលត្រឡប់ពីលំហូរចុះមកជាលំហូរឡើងវិញដែលបានបង្កើតឡើងដោយទាន៣។ ដែលទានទី១គឺជាទម្រងទានចុះធំមួយ។ ទានទី២គឺជាទានដែលតូច ពេលខ្លះអាចជាទម្រង់ doji ដែលបង្ហាញពីភាពមិនច្បាស់លាស់នៃអ្នកចូលរួមនៅក្នុងទីផ្សារ ហើយក៏បង្ហាញផងដែរថាកម្លាំងអ្នកលក់កំពុងតែតែចុះក្សោយ។ ទានទី៣ជាទានដែលឡើងខ្លាំងមួយដែលបង្ហាញពីការផ្លាស់ប្តូរលំហូរ។ ឧទាហរណ៍ ទម្រង់ទានមួយនេះវាជាសញ្ញាបញ្ជាក់យ៉ាងរឹងមាំមួយថាហ្នឹងមានការផ្លាសប្តូរលំហូរនៅពេលខាងមុខនេះ។ អ្នកជួញដូរតែងប្រើប្រាស់វាដើម្បីកំណត់កំរិតការខាតនៅខាងក្រោម ទានទី២ ឬទានទី៣។ ការសិក្សារមួយក្រោមប្រធានបទ “Candlestick Charting and Technical Analysis: An Empirical Analysis” ធ្វើឡើងដោយលោក Cheol-Ho Park and Scott H. Irwin ដែលបានបោះពុម្ភផ្សាយនៅក្នុងបោះពុម្ភផ្សាយនៅក្នុងទិនានុប្បវត្តិនៃទីផ្សារហិរញ្ញវត្ថុ បានធ្វើការវិភាគលើទម្រង់ទានផ្សេងៗ និងអត្រាជោគជ័យរបស់ពួកគេក្នុងការព្យាករណ៍ចលនាទីផ្សារ។ យោងតាមការរកឃើញរបស់ពួកគេ ទម្រង់ morning star បង្ហាញពីអត្រាជោគជ័យប្រហែល 65% ក្នុងការព្យាករណ៍ពីការកើនឡើងនៃទីផ្សារបន្ទាប់ពីវាបានបង្ហាញខ្លួន។ (English Version) What is the Morning Star Pattern? Definition A pattern is a bullish reversal pattern that typically appears at the end of a downtrend. Appearance Characteristics The morning star candlestick pattern is a bullish reversal pattern which is made up of three candles. The first candle is a strong bearish candle. The second candle is a small candle, sometimes doji which shows the indecision of the market participants and also shows that the sellers are getting weak។ The third candle is a strong bullish candle which marks the trend change. Example This candlestick pattern is a strong indication of the potential trend reversal. Traders use this pattern to set up stop losses below the doji or the bullish candle. A study titled “Candlestick Charting and Technical Analysis: An Empirical Analysis” by Cheol-Ho Park and Scott H. Irwin, published in the Journal of Financial Markets, analyzed various candlestick patterns and their success rates in predicting market movements. According to their findings, the morning star pattern demonstrated a success rate of approximately 65% in forecasting bullish reversals.
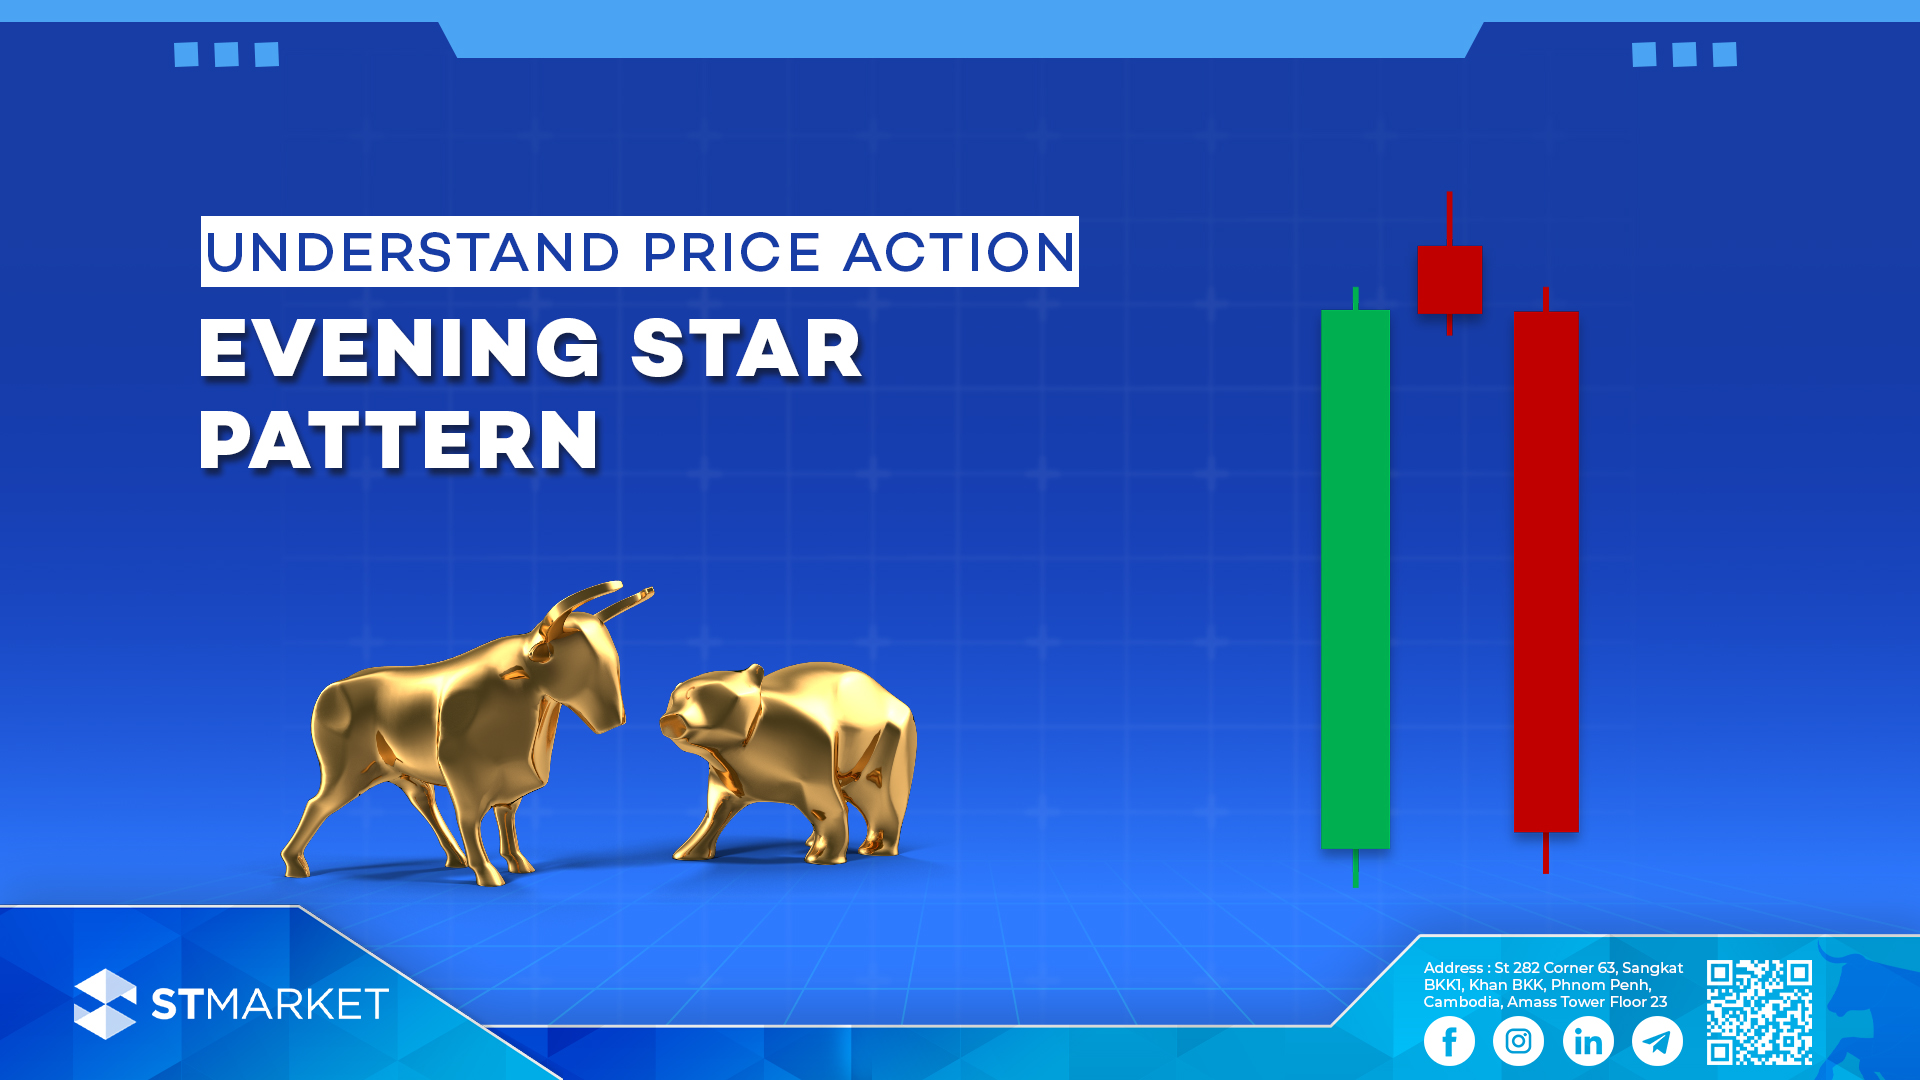
Understand Evening Star Pattern អ្វីទៅជា Evening Star Pattern? និយមន័យ Evening Star Pattern គឺជាសញ្ញាវិលត្រឡប់នៃលំហូរឡើង វាបង្ហាញភាគច្រើននៅចុងនៃលំហូរឡើង។ រូបរាង លក្ខណៈសម្គាល់ Evening Star Pattern គឺជាទម្រង់នៃការវិលត្រឡប់ពីលំហូរឡើងមកជាលំហូរចុះវិញដែលបានបង្កើតឡើងដោយទាន៣។ ដែលទានទី១គឺជាទម្រងទានឡើងធំមួយ។ ទានទី២គឺជាទានដែលតូច ពេលខ្លះអាចជាទម្រង់ doji ដែលបង្ហាញពីភាពមិនច្បាស់លាស់នៃអ្នកចូលរួមនៅក្នុងទីផ្សារ ហើយក៏បង្ហាញផងដែរថាកម្លាំងអ្នកលក់កំពុងតែចុះខ្សោយ។ ទានទី៣ជាទានដែលចុះខ្លាំង ដែលបង្ហាញពីការផ្លាស់ប្តូរលំហូរ។ ឧទាហរណ៍ ទម្រង់ទានមួយនេះវាជាសញ្ញាបញ្ជាក់យ៉ាងរឹងមាំមួយថាហ្នឹងមានការផ្លាសប្តូរលំហូរនៅពេលខាងមុខនេះ។ អ្នកជួញដូរតែងប្រើប្រាស់វាដើម្បីកំណត់កម្រិតការខាតនៅខាងលើ ទានទី២ ឬទានទី៣។ ការសិក្សារមួយដែលបានបានចេញផ្សាយនៅ“Journal of Technical Analysis” ក្រោមប្រធានបទ “Evaluating the Performance of Candlestick Patterns in Financial Markets” ធ្វើឡើងដោយលោក David Aronson យោងតាមការរកឃើញរបស់ពួកគេ ទម្រង់ morning star បង្ហាញពីអត្រាជោគជ័យប្រហែល 69% ក្នុងការព្យាករណ៍ពីការធ្លាក់ចុះនៃទីផ្សារបន្ទាប់ពីវាបានបង្ហាញខ្លួន។ (English Version) What is the Evening Star Pattern? Definition A pattern is a bearish reversal pattern that typically appears at the end of an uptrend. Appearance Characteristics An evening star candlestick pattern is a bearish reversal pattern. Evening star pattern consists of three candles. The first candle is a robustly positive one. The second candle is a doji, which indicates both buyer weakness and the indecision of the market players. A strong bearish candle that marks the trend change is the third one. Example The strong bullish candle at the beginning represents the buying pressure in the market, while the doji candle that follows indicates indecision and a weakening of the buying pressure. The final strong bearish candle then confirms the bearish reversal, signaling that the sellers have taken control of the market. According to a study published in the “Journal of Technical Analysis” by David Aronson and Timothy Masters, titled “Evaluating the Performance of Candlestick Patterns in Financial Markets,” the Evening Star pattern has a success rate of approximately 69% in predicting bearish reversals.
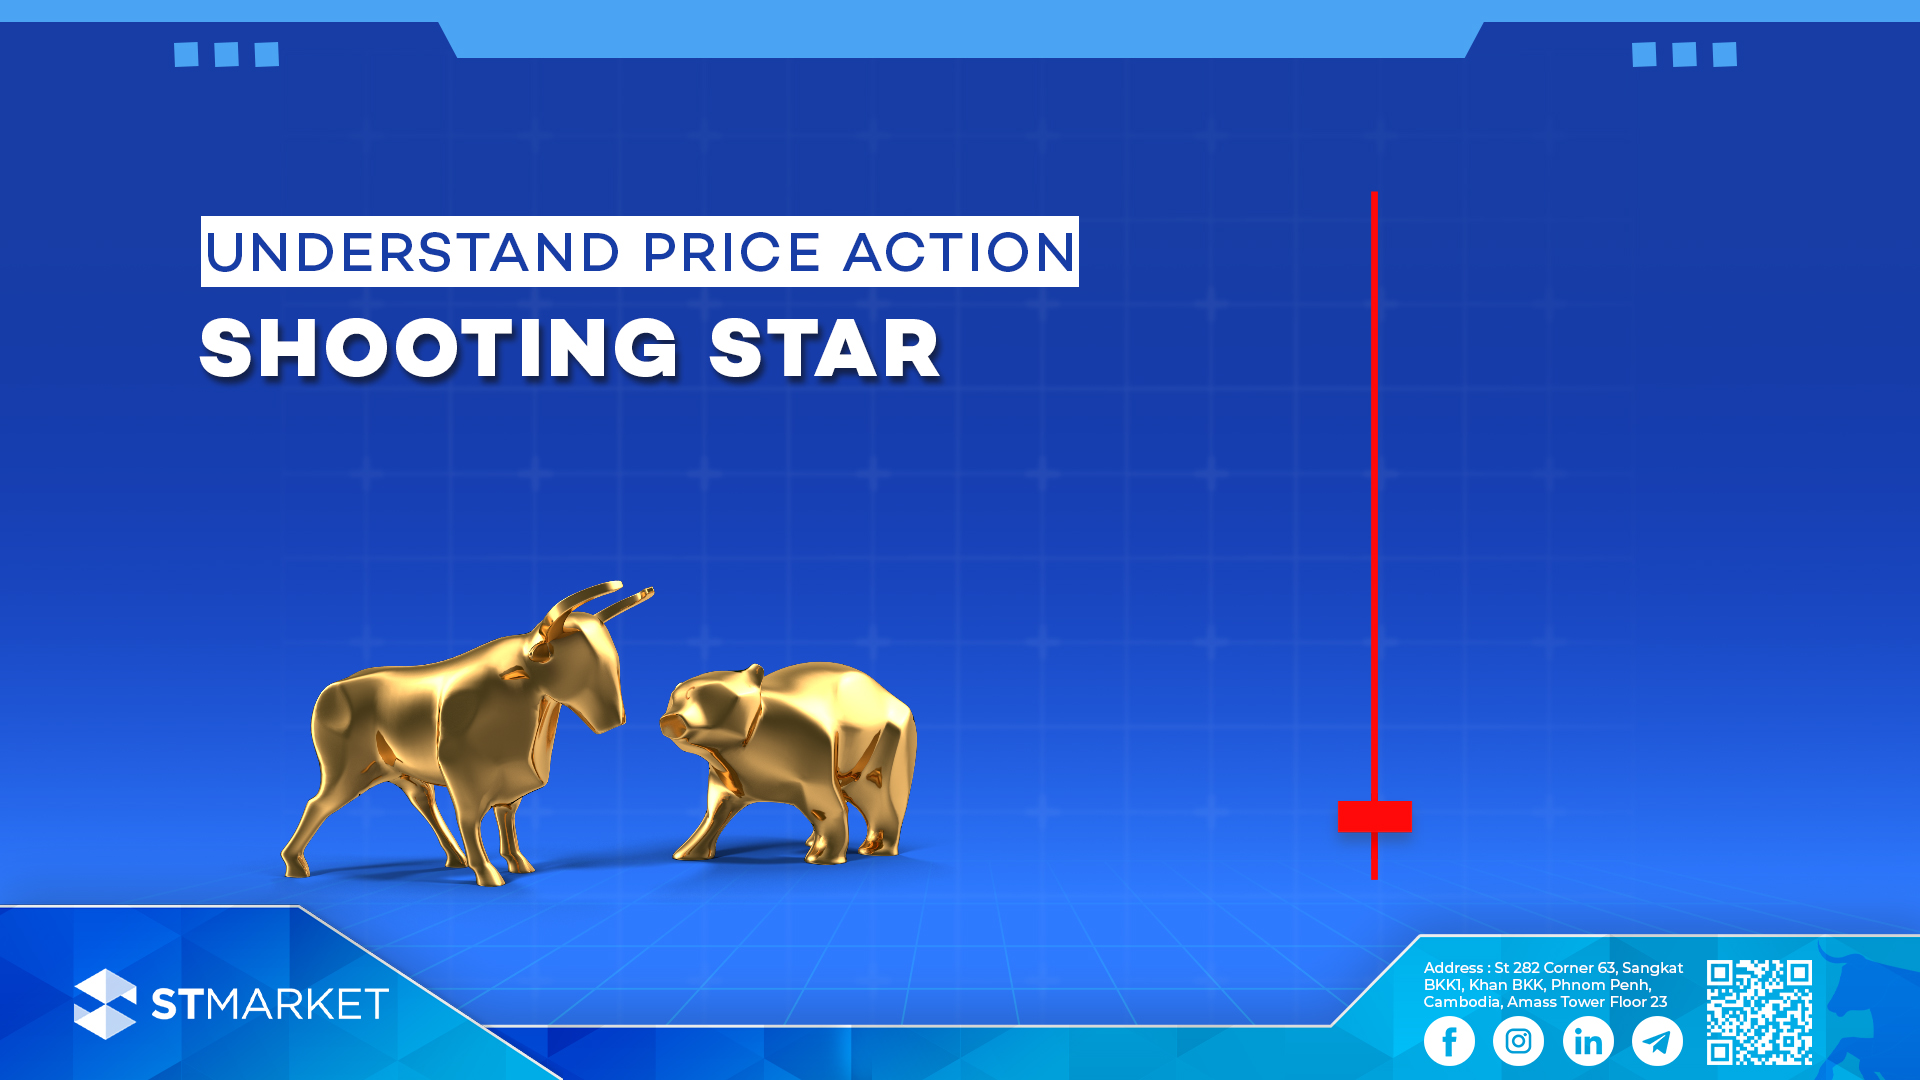
Understanding Shooting Star Candlestick Patterns តើអ្វីទៅជា Shooting Star Candlestick Pattern? និយមន័យ Shooting Star candlestick Pattern គឺជាទម្រង់នៃសញ្ញាវិលត្រឡប់ដែលមានតែមួយទានគត់។ វាមានស្រមោលខាងលើវែងនិងមានតួខ្លួនតូច។ វាប្រាប់យើងថានឹងមានការប្តូរទិសពីឡើងមកចុះ នៅពេលដែលវាកើត។ រូបរាង លក្ខណៈសម្គាល់ ក្នុងទិសដៅកើនឡើង Shooting Star បានបង្កើតឡើងនៅពេលដែលតម្លៃព្យាយាមឡើងខ្ពស់ ប៉ុន្តែជាមួយនឹងចំនួនអ្នកទិញច្រើនដែលអាចធ្វើឱ្យតម្លៃបានធ្លាក់ចុះ នោះShooting Star ត្រូវបានបង្កើតឡើង។ ទាំងនេះបានសបញ្ជាក់ថា ចំនួនអ្នកទិញមានច្រើន ហើយការផ្លាស់ប្តូរទិសអាចនឹងកើតមានឡើង។ ឩទាហរណ៍ Shooting Star patternកើតឡើងនៅពេលដែលទីផ្សារស្រាប់តែមានការឈប់ភា្លមៗនៅពេលដែលវាកំពុងរត់ក្នុងលំហូរឡើង។ ស្រមោលខាងលើកាន់តែវែងបញ្ជាក់ប្រាប់យើងថាអ្នកទិញព្យាយាមរុញទីផ្សារអោយឡើង ប៉ុន្តែអ្នកលក់បានរុញវាត្រឡប់មកវិញយ៉ាងជោគជ័យ បង្កើតបានទៅជាស្រមោលដ៏វែង។ ទម្រង់បែបនេះផ្តល់សញ្ញាប្រាប់យើងថាអាចហ្នឹងមានការផ្លាស់ប្តូរសន្ទុះកម្លាំងនៅក្នុងទីផ្សារ ដែលប្រាប់យើងថាអ្នកលក់កំពុងគ្រប់គ្រងទីផ្សារ ហើយលំហូរដែលកំពុងតែឡើងអាចហ្នឹងប្តូរមកចុះវិញ។ ការសិក្សារមួយក្រោមប្រធានបទ “The Performance of Candlestick Patterns in Financial Markets” ដែលបានបោះពុម្ភផ្សារយនៅក្នុង Journal of Technical Analysis ដោយលោកDr. Thomas Bulkowski ដែលឈានមុខគេក្នុងការវិភាគ chart patternsបានរកឃើញថា Shooting Star pattern មានអត្រាជោគជ័យរហូតដល់ 59% ក្នុងការព្យាករណ៍ថាទិសដៅផ្សារនឹងមានការវិលត្រឡប់ពីឡើងមកចុះវិញ។ What is Shooting Star Candlestick Pattern? Definition A shooting star is a bearish reversal candlestick pattern that typically forms after an uptrend. It signals that a potential top is forming and that the price may start to fall. Appearance Characteristics The shooting star candlestick pattern is a bearish reversal signal that consists of a single candle. It features a long upper wick and a small or non-existent body. Confirmation of this pattern occurs when a strong bearish candle appears after the shooting star. Example The shooting star pattern forms when the market suddenly rejects bullish momentum. The long upper wick signifies that buyers tried to drive the price up, but sellers successfully pushed it back down, creating the extended wick. This pattern signals a possible shift in market sentiment, indicating that bears may be gaining control and the uptrend could reverse. In a study titled “The Performance of Candlestick Patterns in Financial Markets” published in the Journal of Technical Analysis, Dr. Thomas Bulkowski, a leading authority on chart patterns, found that the Shooting Star pattern has a success rate of around 59% in forecasting bearish reversals.
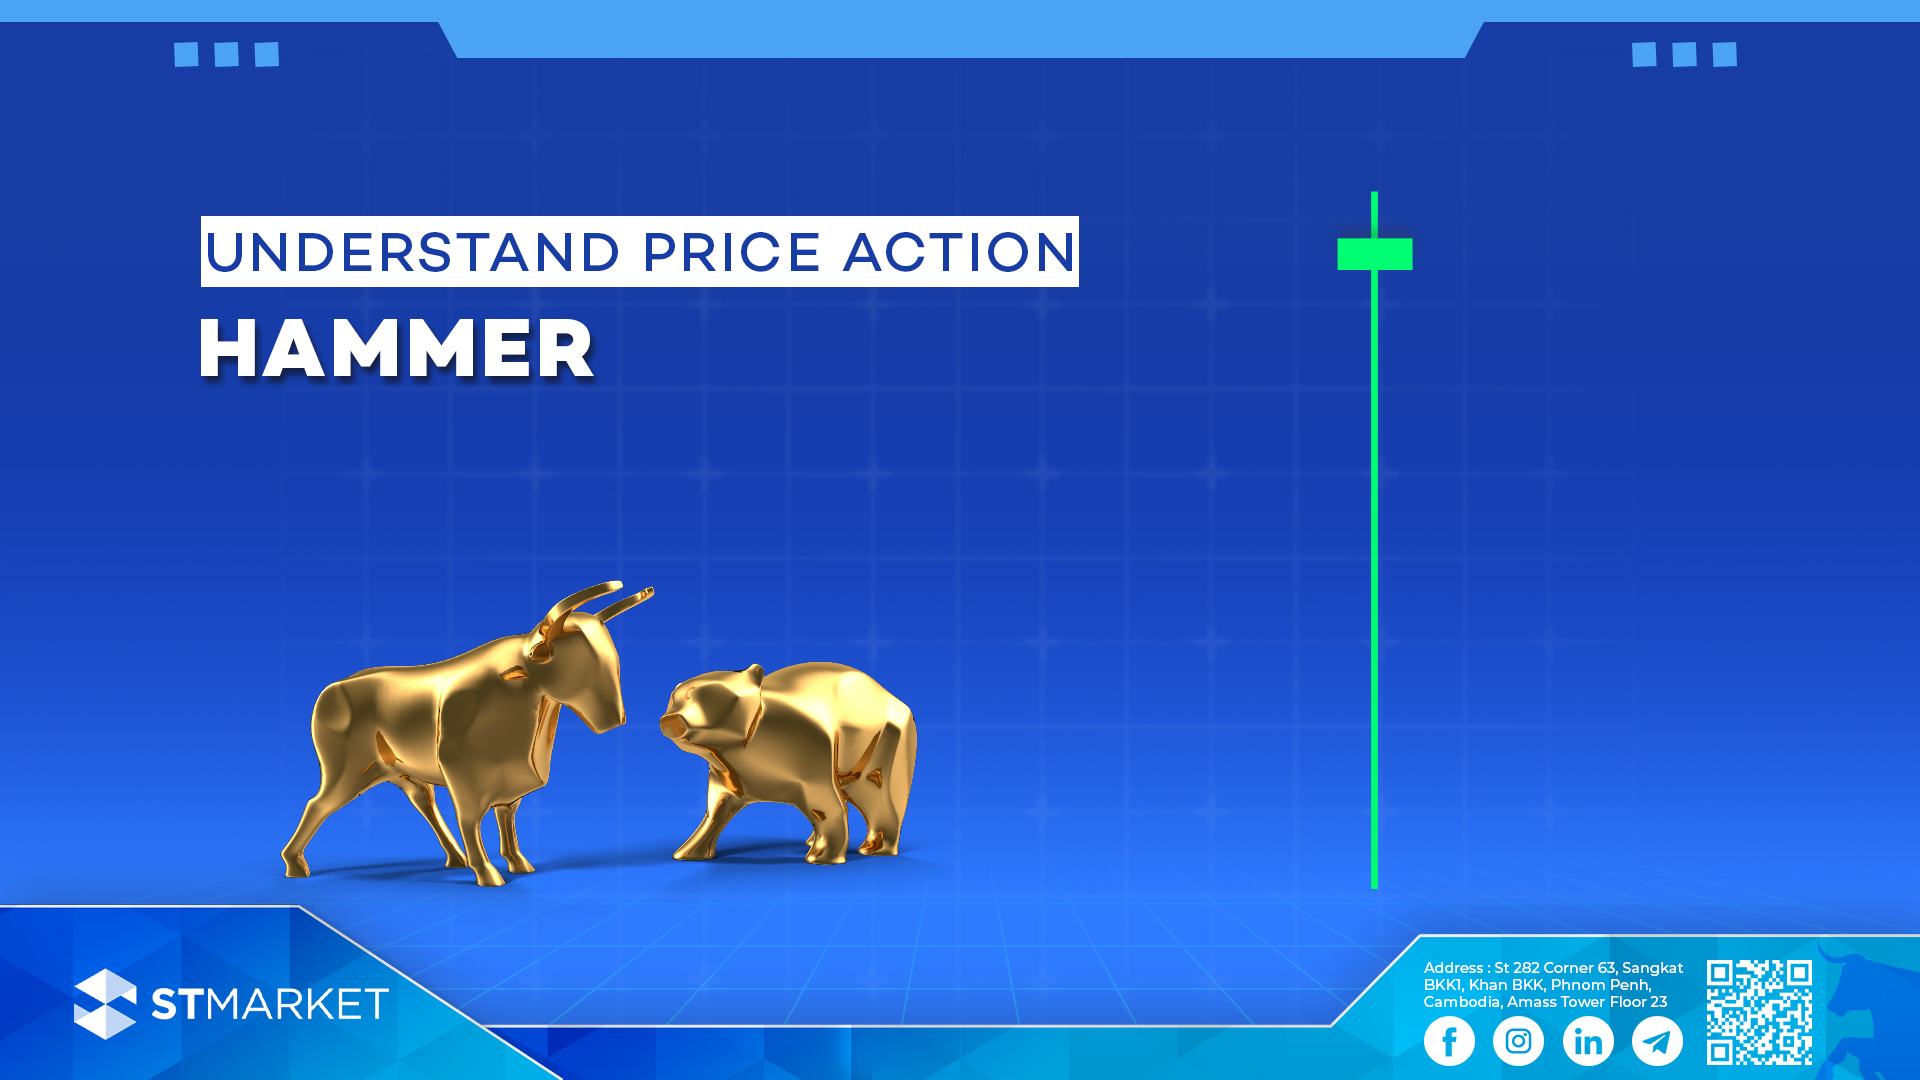
Understanding Hammer Candlestick Patterns តើអ្វីទៅជា Hammer Candlestick Pattern? និយមន័យ Hammer គឺជាប្រភេទនៃ Candle Stick ដែលបង្ហាញពីសញ្ញានៃការវិលត្រឡប់ទៅលំហូរឡើង ពោលគឺការផ្លាស់ប្តូរពីលំហូរចុះទៅលំហូរឡើង។ វាបានផ្តល់នូវសញ្ញាថា អាចនឹងមានលទ្ធភាពដែលតម្លៃអាចនឹងចាប់ផ្តើមកើនឡើង។ រូបរាង លក្ខណៈសម្គាល់ នៅក្នុងលំហូរចុះ ប្រភេទ Hammer Candlestick Pattern គឺចាប់ផ្តើមបង្កើតឡើងនៅពេលដែលតម្លៃព្យាយាមរុញចុះទៅក្រោមបន្តទៀត ប៉ុន្តែគួបផ្សំជាមួយនឹងចំនួនអ្នកទិញកាន់តែច្រើនដែលធ្វើឱ្យតម្លៃកើនឡើង។ ទាំងនេះបានបង្កើតជាទម្រង់ Hammer ដែលបង្ហាញថាចំនួនអ្នកទិញមានច្រើននៅក្នុងទីផ្សារ ហើយបម្រែបម្រួលអាចនឹងកើតមាន។ ឩទាហរណ៍ hammer pattern កើតឡើងនៅពេលដែលទីផ្សារបើកមកហើយក៏បានធ្លាក់ចុះទៅទាប ប៉ុន្តែអ្នកទិញស្រាប់តែចូលមកហើយនាំអោយតម្លៃទីផ្សារហក់ឡើងវិញទៅបិទនៅជិតតម្លៃខ្ពស់របស់វា។ ស្រមោលក្រោមវែងបង្ហាញពីអ្នកទិញបានចូលមកគ្រប់គ្រង។ ទម្រង់patternនេះផ្តល់សញ្ញាប្រាប់យើងថាអាចហ្នឹងមានការផ្លាស់សន្ទុះកម្លាំងពីអ្នកលក់មកជាអ្នកទិញគ្រប់គ្រងទីផ្សារវិញ។ នៅក្នុងការសិក្សារមួយ*”An Empirical Evaluation of the Performance of Technical Analysis,”* ដែលបានបោះផ្សាយនៅក្នុង*Journal of Futures Markets* ដោយលោក Brett N. Steenbarger បានរកឃើញថា hammer candlestick pattern មានអត្រាជោគជ័យប្រហែល៦២%ក្នុងការព្យាករណ៍ថាផ្សារអាចហ្នឹងមានការវិលត្រឡប់ពីចុះមកឡើងវិញ។ English Version What is a Hammer Candlestick Pattern? Definition A hammer candlestick pattern is a bullish reversal candlestick pattern that typically forms after a downtrend. It signals that a potential bottom is forming and that the price may start to rise. Appearance Characteristics In a downtrend, a hammer forms when the price attempts to push lower but is met with strong buying pressure that drives the price back up, creating the hammer shape. This indicates that buyers are taking control of the market and a reversal may occur. Example The hammer pattern forms when the market opens and drops lower, but buyers step in and drive the price back up, closing the candle near its daily high. The long lower wick reflects the sellers’ unsuccessful attempt to push the price down, while the close near the high indicates that buyers have regained control. This pattern signals a possible shift in market sentiment from bearish to bullish. In the study *”An Empirical Evaluation of the Performance of Technical Analysis,”* published in the *Journal of Futures Markets*, Brett N. Steenbarger found that the hammer candlestick pattern has a success rate of about 62% in predicting bullish reversals.
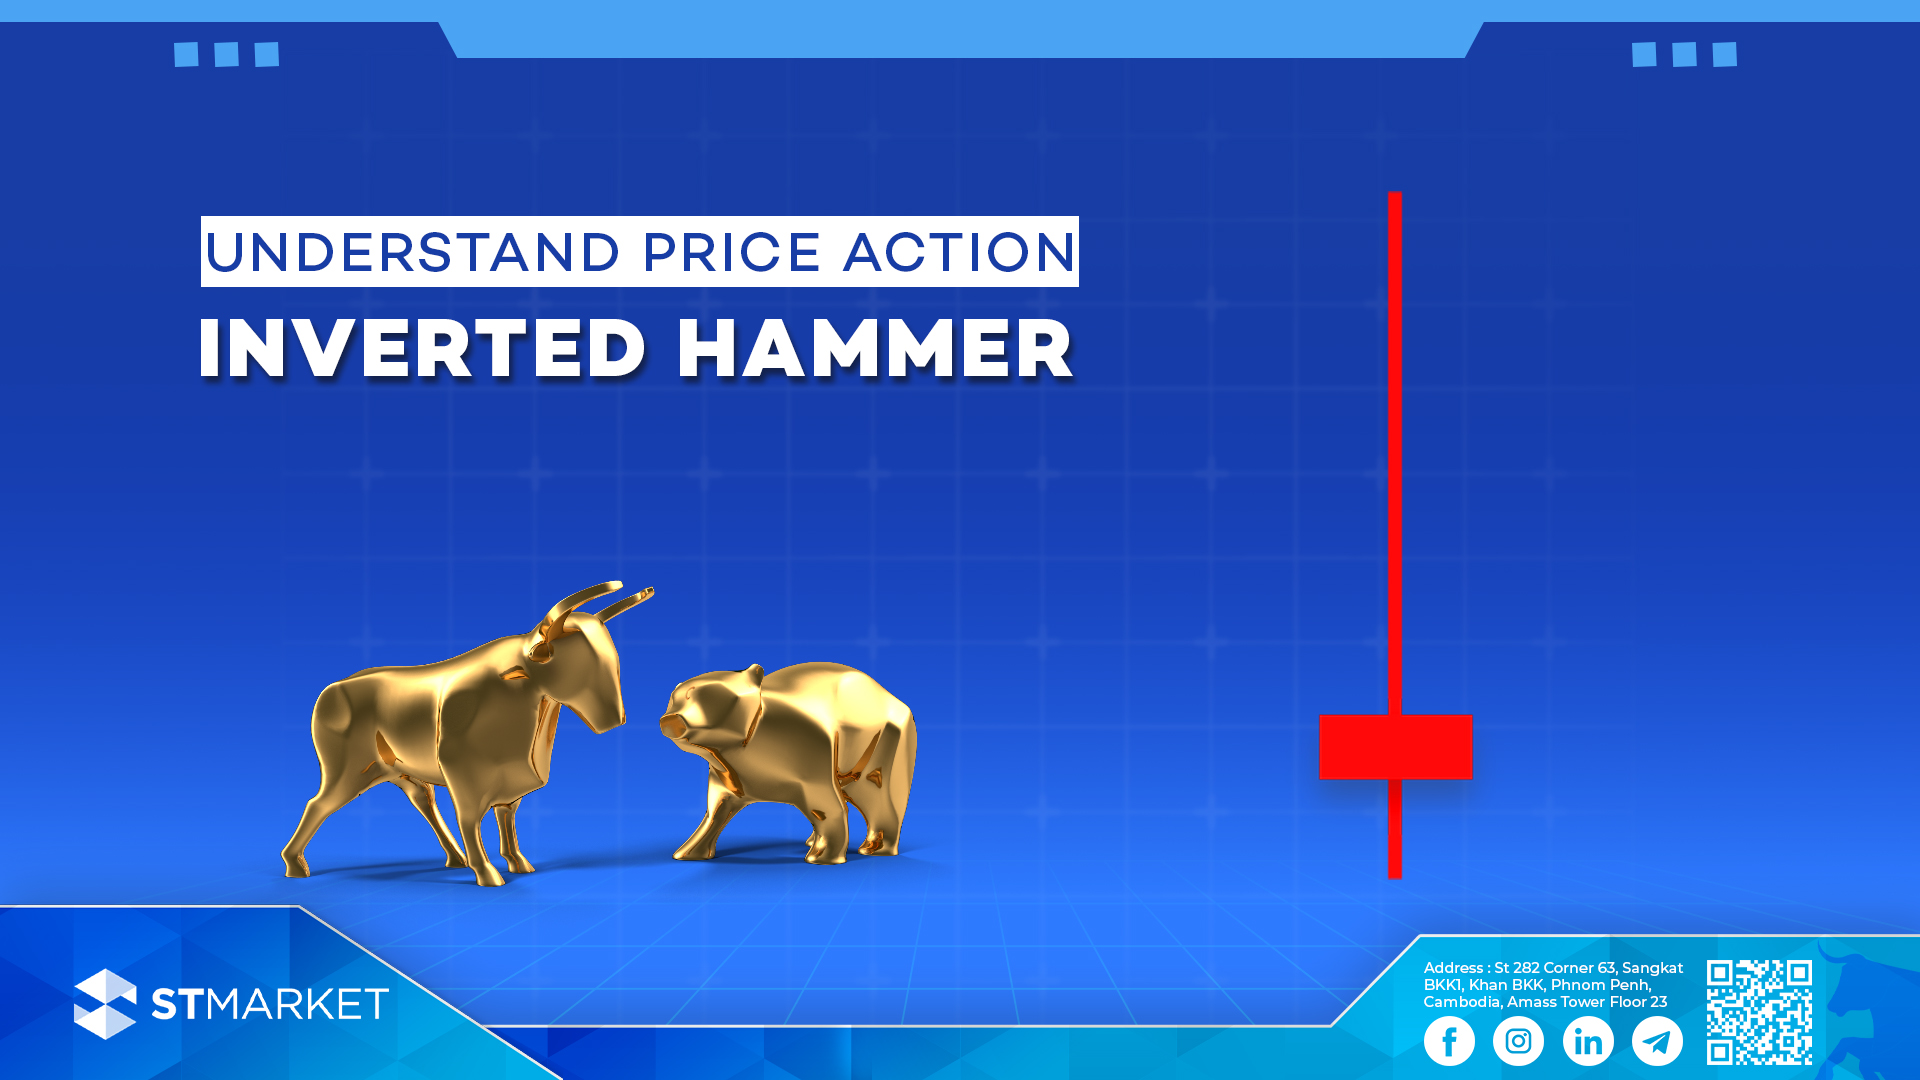
Understand Inverted Hammer Candlestick Patterns តើអ្វីទៅជា Inverted Hammer Candlestick Pattern? និយមន័យ Inverted Hammer គឺជាប្រភេទនៃ Candle Stick ដែលបង្ហាញពីសញ្ញានៃការវិលត្រឡប់ទៅលំហូរឡើង ពោលគឺការផ្លាស់ប្តូរពីលំហូរចុះទៅលំហូរឡើង។ វាបានផ្តល់នូវសញ្ញាថា អាចនឹងមានលទ្ធភាពដែលតម្លៃអាចនឹងចាប់ផ្តើមកើនឡើង។ រូបរាង លក្ខណៈសម្គាល់ Inverted hammer candlestick pattern គឺជាប្រភេទទានដាច់តែឯងមួយដែលតែងតែលេចឡើងបន្ទាប់ពីលំហូរចុះបានកើតឡើង។ វាមានលក្ខណៈស្រដៀងនឹងHammer Candlestick Pattern ប៉ុន្តែត្រឡប់ក្បាលចុះក្រោម។ ឩទាហរណ៍ ស្រមោលខាងលើនៃInverted hammer បានបង្ហាញពីកម្លាំងអ្នកទិញចូលមកនៅអំឡុងពេលនោះ ហើយតម្លៃត្រឡប់ទៅកៀកកំរិតតម្លៃបើកវិញ។ ទម្រង់ទាននេះផ្តល់សញ្ញាអោយយើងបានដឹងថា អាចនឹងមានការផ្លាស់ប្តូរលំហូរ ដែលប្រាប់យើងថាកម្លាំងអ្នកទិញទំនងជាចុះខ្សោយ ហើយទីផ្សារអាចនឹងផ្លាស់ប្តូរពីលំហូរចុះមកលំហូរឡើងឆាប់ៗ។ នៅក្នុងការសិក្សារមួយធ្វើឡើងដោយ Corey Rosenbloom, CFA, បោះពុម្ភនៅលើវេបសាយ ” Afraid to Trade” inverted hammer pattern បានបង្ហាញពីអត្រាជោគជ័យប្រហែល65%នៅក្នុងការព្យាករណ៍ពីការប្តូរទិសពីចុះមកឡើងវិញ។ ការស្រាវជ្រាវរបស់ Rosenbloom បានវិភាគប្រវត្តិទិន្នន័យរបស់ទីផ្សារភាគហ៊ុនចេញពីទីផ្សារផ្សេងៗដើម្បីឈ្វេងយល់ពីលទ្ធភាព និងទម្រង់ទានដែលគួរឱ្យទុកចិត្តបានជាច្រើនក្នុងនោះមាន inverted hammerផងដែរ។ English Version What is a Hammer Candlestick Pattern? Definition An inverted hammer candlestick pattern is a bullish reversal candlestick pattern that typically forms after a downtrend. It signals that a potential bottom is forming and that the price may start to rise. Appearance Characteristics The inverted hammer candlestick pattern is a single-candle formation that usually appears after a downtrend. It resembles the hammer pattern but has an upside-down appearance. Example The long upper shadow of the inverted hammer indicates that bullish buying pressure surfaced during the session, driving the price back near the opening level. This pattern signals a potential reversal, suggesting that selling pressure may have weakened and the market could be ready for a trend reversal or bullish continuation. In a study by Corey Rosenbloom, CFA, published on the website “Afraid to Trade,” the inverted hammer pattern demonstrated a success rate of around 65% in predicting bullish reversals. Rosenbloom’s research analyzed historical stock data from various markets to assess the performance and reliability of several candlestick patterns, including the inverted hammer.
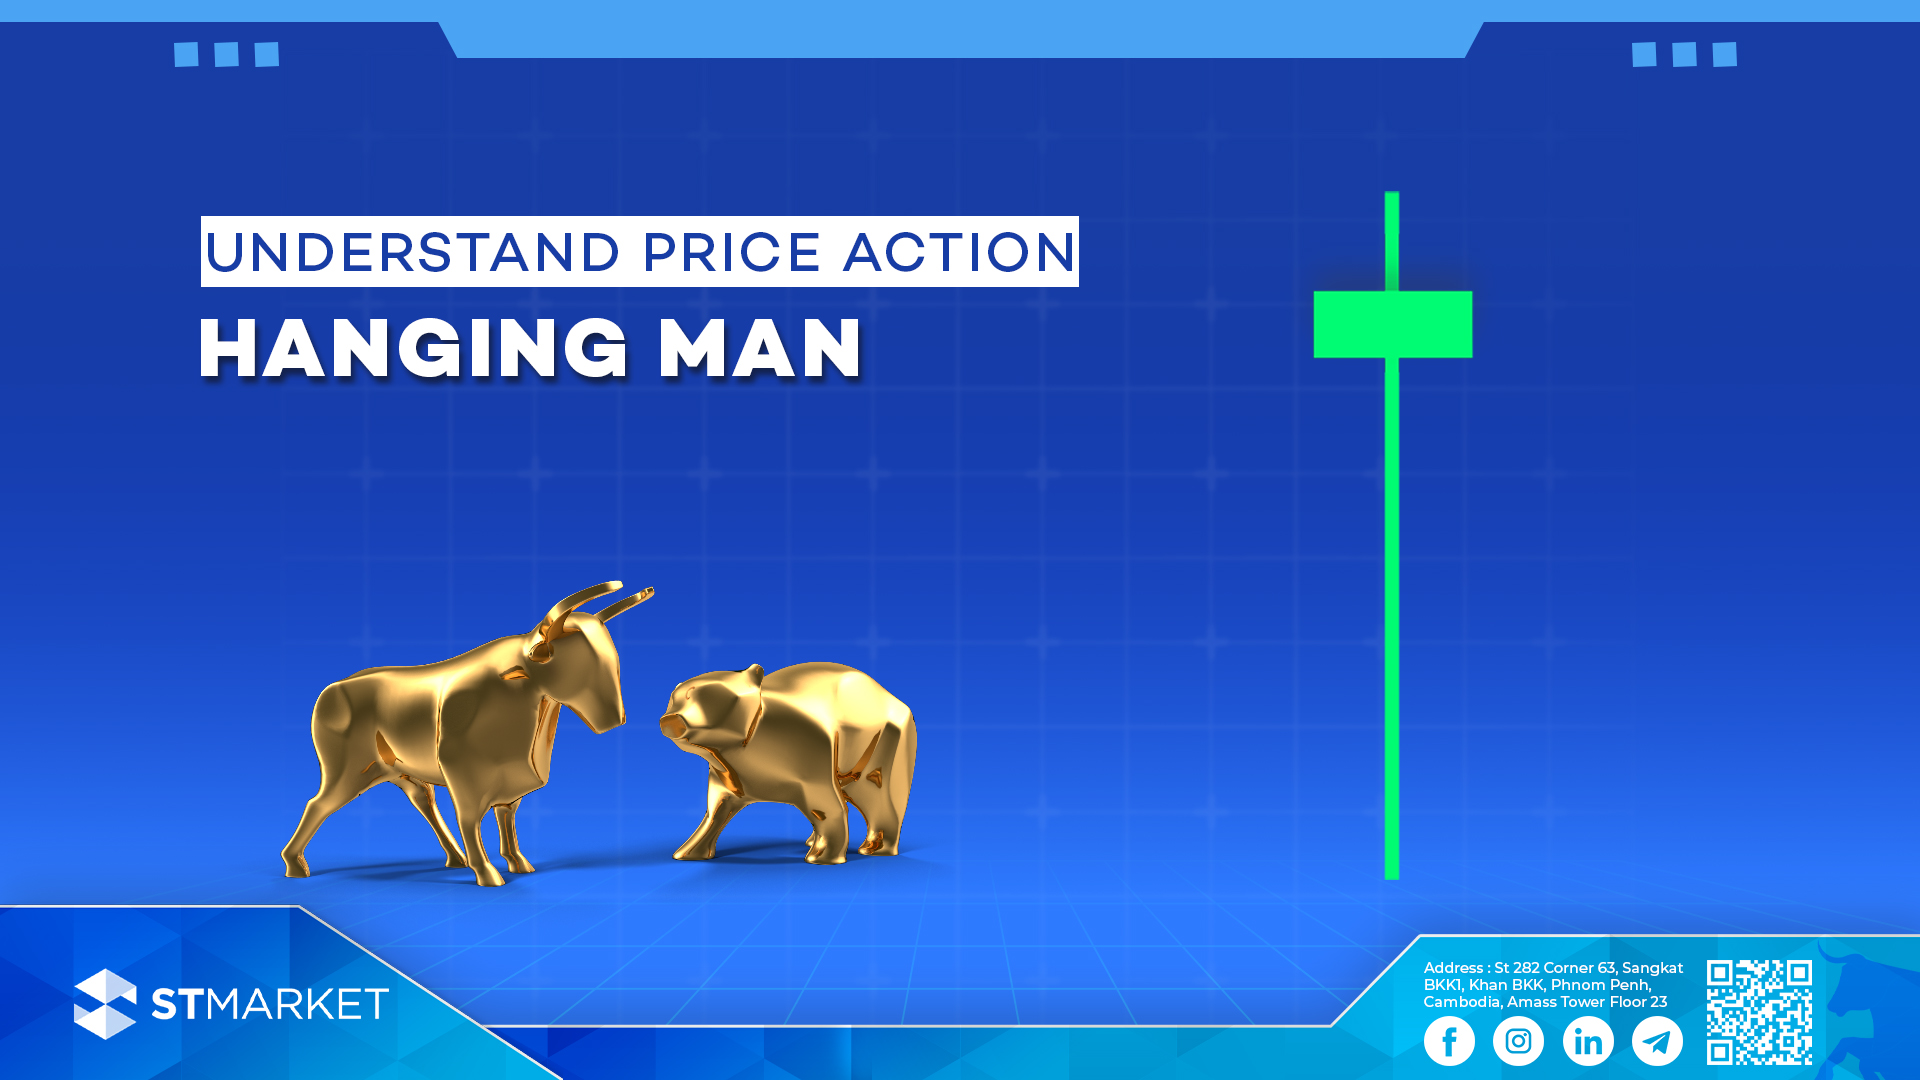
Understanding Hanging Man Candlestick Patterns តើអ្វីទៅជា Hanging Man Candlestick Pattern? និយមន័យ Hanging man candlestick pattern គឺជាប្រភេទទានដែលបង្ហាញពីសញ្ញាវិលត្រឡប់ទៅជាលំហូរចុះវិញឬយើងហៅថា វាផ្តល់សញ្ញាថាកំពូលរបស់ទីផ្សារកំពុងកើតឡើងហើយតម្លៃអាចហ្នឹងចាប់ផ្តើមធ្លាក់ចុះ។ រូបរាង លក្ខណៈសម្គាល់ Hanging man candlestick pattern គឺជាប្រភេទទានដាច់តែឯងមួយដែលតែងតែលេចឡើងបន្ទាប់ពីលំហូរឡើងបានកើតឡើង។ វាមានលក្ខណៈដូចទៅនឹងHammer Candlestick Patternតែវាស្ថិតនៅទីតាំងនៅខាងចុងនៃលំហូរឡើង។ ឩទាហរណ៍ ទម្រង់ទាន hanging man កើតឡោះងកំឡុងពេលផ្សាររត់ក្នុងលំហូរឡើងនៅពេលដែលទានដែលមានស្រមោលខាងក្រោមវែងកើតឡើង។ ទានបើក ហើយតម្លៃចាប់ផ្តើមធ្លាក់ចុះ។ ហើយនៅចុងម៉ោង អ្នកទិញព្យាយាមចូលមកវិញរុញតម្លៃទីផ្សារអោយឡើងលើវិញ ធ្វើអោយទានបិទនៅក្បែរតម្លៃបើកវិញ ដែលបង្កើតបានជាស្រមោលខាងក្រោមដ៏វែងដែលយើងហៅទាននេះថា Hanging Man។ ទម្រង់ទាន hanging man ត្រូវបានមើលឃើញថាជាសញ្ញាវិលត្រឡប់ពីឡើងមកចុះនៅក្នុងលំហូរទីផ្សារ បង្ហាញថាមានការចុះក្សោយនៅក្នុងទីផ្សារ ហើយអ្នកទិញកំពុងតែបាត់បង់ការគ្រប់គ្រងលើតម្លៃ។ ស្រមោលខាងក្រោមយ៉ាងវែងបង្ហាញថាអ្នកលក់អាចរុញតម្លៃចុះគួរអោយកត់សម្គាល់ ទោះបីជាអ្នកទិញអាចស្តារតម្លៃបានខ្លះនៅពេលបញ្ចប់សកម្មភាពក៏ដោយ។ ការសិក្សារមួយធ្វើឡើងដោយមជ្ឍមណ្ឌលស្រាវជ្រាវទីផ្សារហិរញ្ញវត្ថុនៅសកលវិទ្យាល័យ Vanderbilt University ក្រោមចំណងជើងថា “Candlestick Patterns and Their Statistical Significance in Financial Markets,” បានរកឃើញថា Hanging Man មានអត្រាជោគជ័យរហូតដល់ 59%ក្នុងការព្យាករណ៍ពីការប្តូរទិសដៅទីផ្សារ។ English Version What is a Hanging Man Candlestick Pattern? Definition A hanging man candlestick pattern is a bearish reversal candlestick pattern that typically forms after an uptrend. It signals that a potential top is forming and that the price may start to fall. Appearance Characteristics The hanging man candlestick pattern is a single-candle formation that usually appears after a uptrend. It resembles the hammer pattern but it happened at the end of the uptrend market. Example The hanging man pattern occurs during an uptrend when a single candlestick with a long lower wick appears. The candle opens, and the price begins to fall. As the session nears its end, bulls try to drive the price back up, causing the candle to close closed to its opening price, which creates the long wick characteristic of the Hanging Man. The hanging man pattern is viewed as a bearish reversal signal, indicating a loss of momentum in the market and that buyers are losing control of prices. The long lower wick shows that bears managed to push the price down considerably, even though bulls managed to recover some ground by the session’s close. A study by the Financial Markets Research Center at Vanderbilt University, featured in their report “Candlestick Patterns and Their Statistical Significance in Financial Markets” found that the Hanging Man pattern has a success rate of around 59% for predicting bearish reversals.
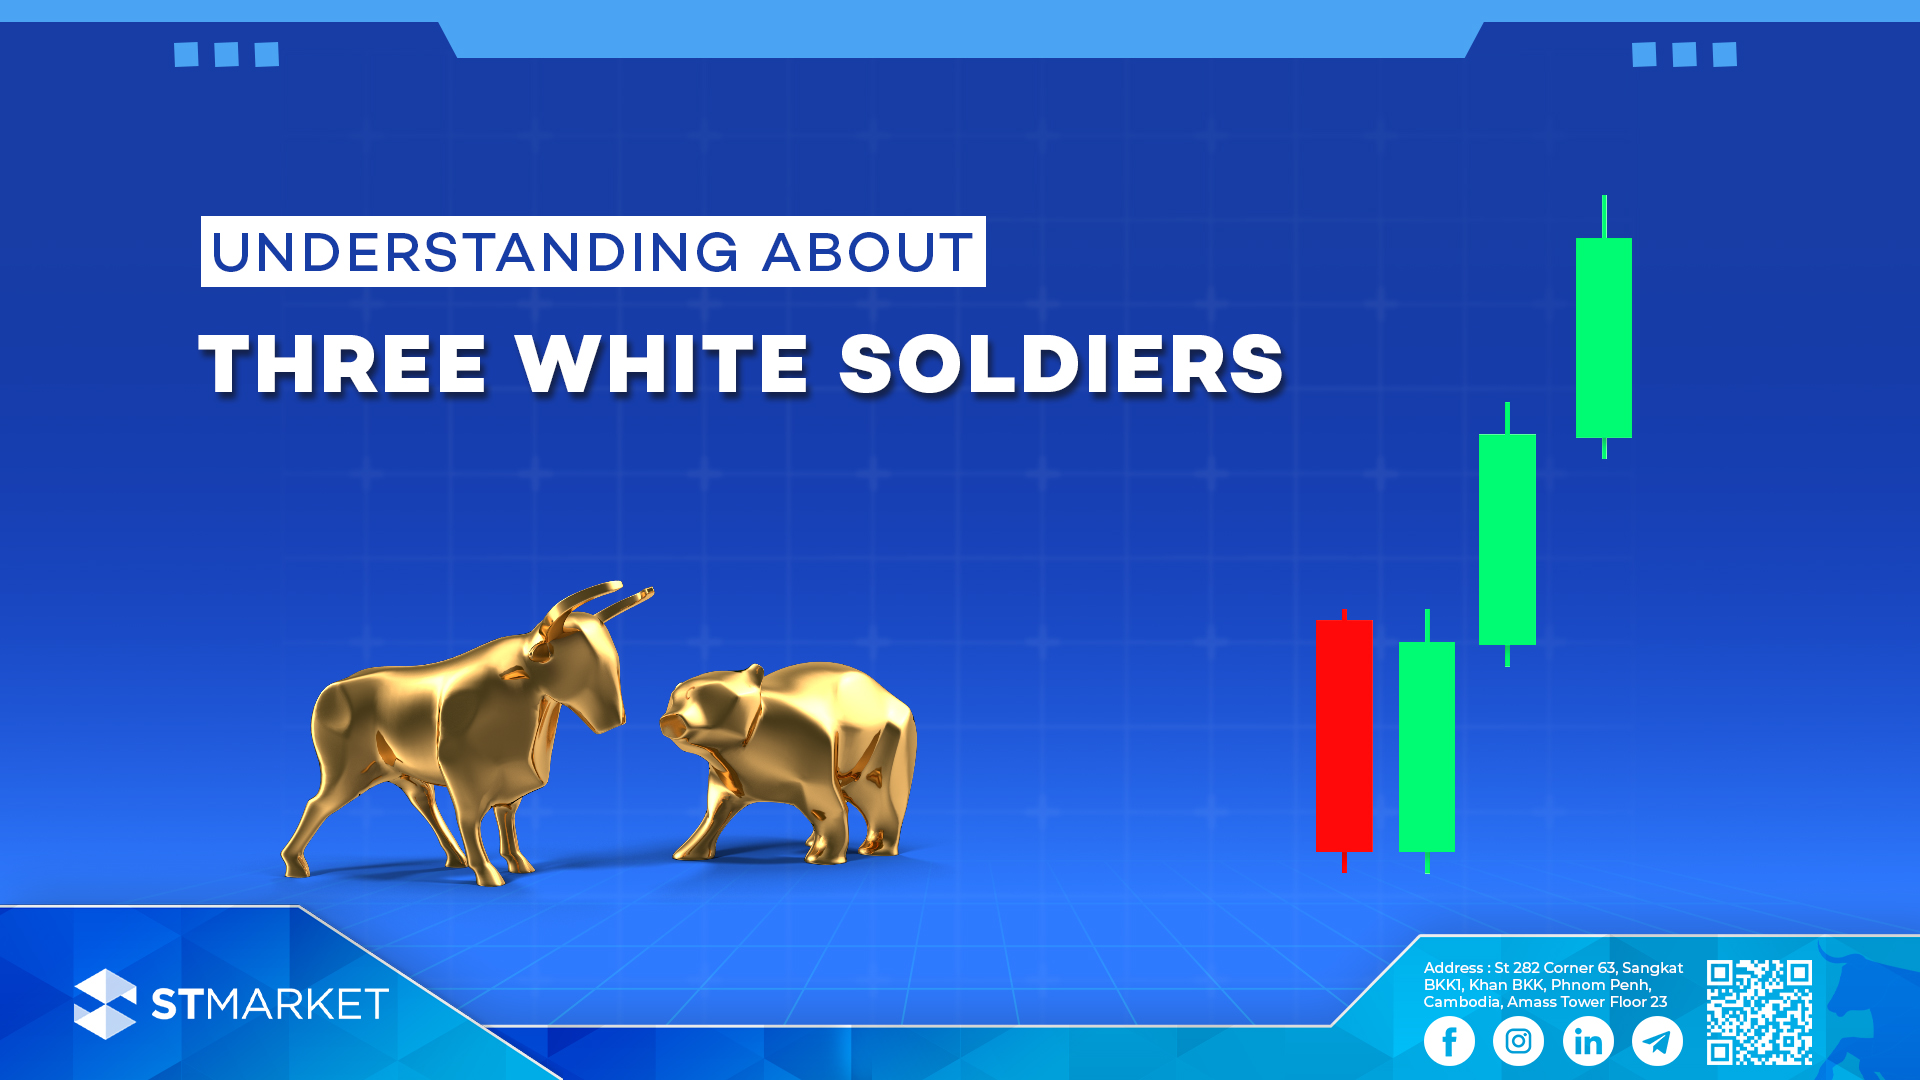
Understanding Three White Soldiers Candlestick Patterns តើអ្វីទៅជា Three White Soldiers Candlestick Pattern? និយមន័យ Three White Soldiers candlestick pattern គឺជាប្រភេទទានដែលបង្ហាញពីសញ្ញាវិលពីលំហូរចុះមកលំហូរឡើងវិញ ដែលជាសញ្ញាបង្ហាញពីលំហូរឡើងហ្នឹងកើតឡើងនៅខាងមុខ។ រូបរាង លក្ខណៈសម្គាល់ Three White Soldiers candlestick patternគឺជាប្រភេទទាន៣រួមគ្នាដែលតែងតែលេចឡើងបន្ទាប់ពីលំហូរចុះ។លក្ខណៈសម្គាល់គឺទានទាំង៣ជាទានឡើងជាប់ៗគ្នាដែលបិទផ្សារនៅតម្លៃខ្ពស់ជាងមុនជានិច្ច។ វាកើតឡើងនៅខាងចុងនៃលំហូរចុះ។ ឩទាហរណ៍ របៀប Three White Soldiers ត្រូវបានបង្កើតឡើងនៅពេលដែលសន្ទស្សន៍អារម្មណ៍ទីផ្សារផ្លាស់ប្តូរយ៉ាងខ្លាំងពីសន្ទស្សន៍អារម្មណ៍ចុះទៅជាសន្ទស្សន៍អារម្មណ៍កើនឡើងវិញ។ ដំបូង វិនិយោគិនអាចមានអារម្មណ៍អវិជ្ជមាន ដោយសារតែមានការធ្លាក់ចុះនៃទីផ្សារ ប៉ុន្តែបន្ទាប់មកមានទម្រង់ទានThree White Soldiersដែលមានការបិទខ្ពស់ឡើងៗ បង្ហាញថាអ្នកទិញបានចាប់ផ្ដើមកាន់កាប់ទីផ្សារហើយ។ របៀបនេះជាសញ្ញានៃការផ្លាស់ប្តូរអារម្មណ៍ចេញពីលំហូរចុះមកជាលំហូរឡើងវិញ។ ការសិក្សាមួយដែលមានចំណងជើង “Candlestick Patterns and Market Trends: An Empirical Study” ធ្វើឡើងដោយTechnical Analysis Research & Education (TARE) Foundation) បានរកឃើញថា Three White Soldiers patternមានអត្រាជោគជ័យប្រហែលជា 82% ក្នុងការព្យាករណ៍ថាទីផ្សារនឹងប្តូរពីលំហូរចុះមកឡើងវិញ។ English Version What is a Three White Soldiers candlestick Pattern? Definition Three White Soldiers candlestick pattern is a bullish reversal candlestick pattern that typically forms after a downtrend. It signals that a potential bullish trend is forming and that the price may start to rise. Appearance Characteristics Three White Soldiers candlestick pattern is a three candlestick formation that usually appears after a downtrend. It consists of three consecutive bullish candlestick pattern with higher closes. It is formed at the end of a downtrend. Example The Three White Soldiers pattern forms when market sentiment undergoes a strong shift from bearish to bullish. Initially, a bearish decline may lead to investor pessimism, but it is followed by three consecutive bullish candles with rising closes, indicating that buyers have gained control. This pattern often signals a potential reversal of the downtrend. A study titled “Candlestick Patterns and Market Trends: An Empirical Study” by the Technical Analysis Research & Education (TARE) Foundation found that the Three White Soldiers pattern has an approximate 82% success rate in predicting bullish reversals.
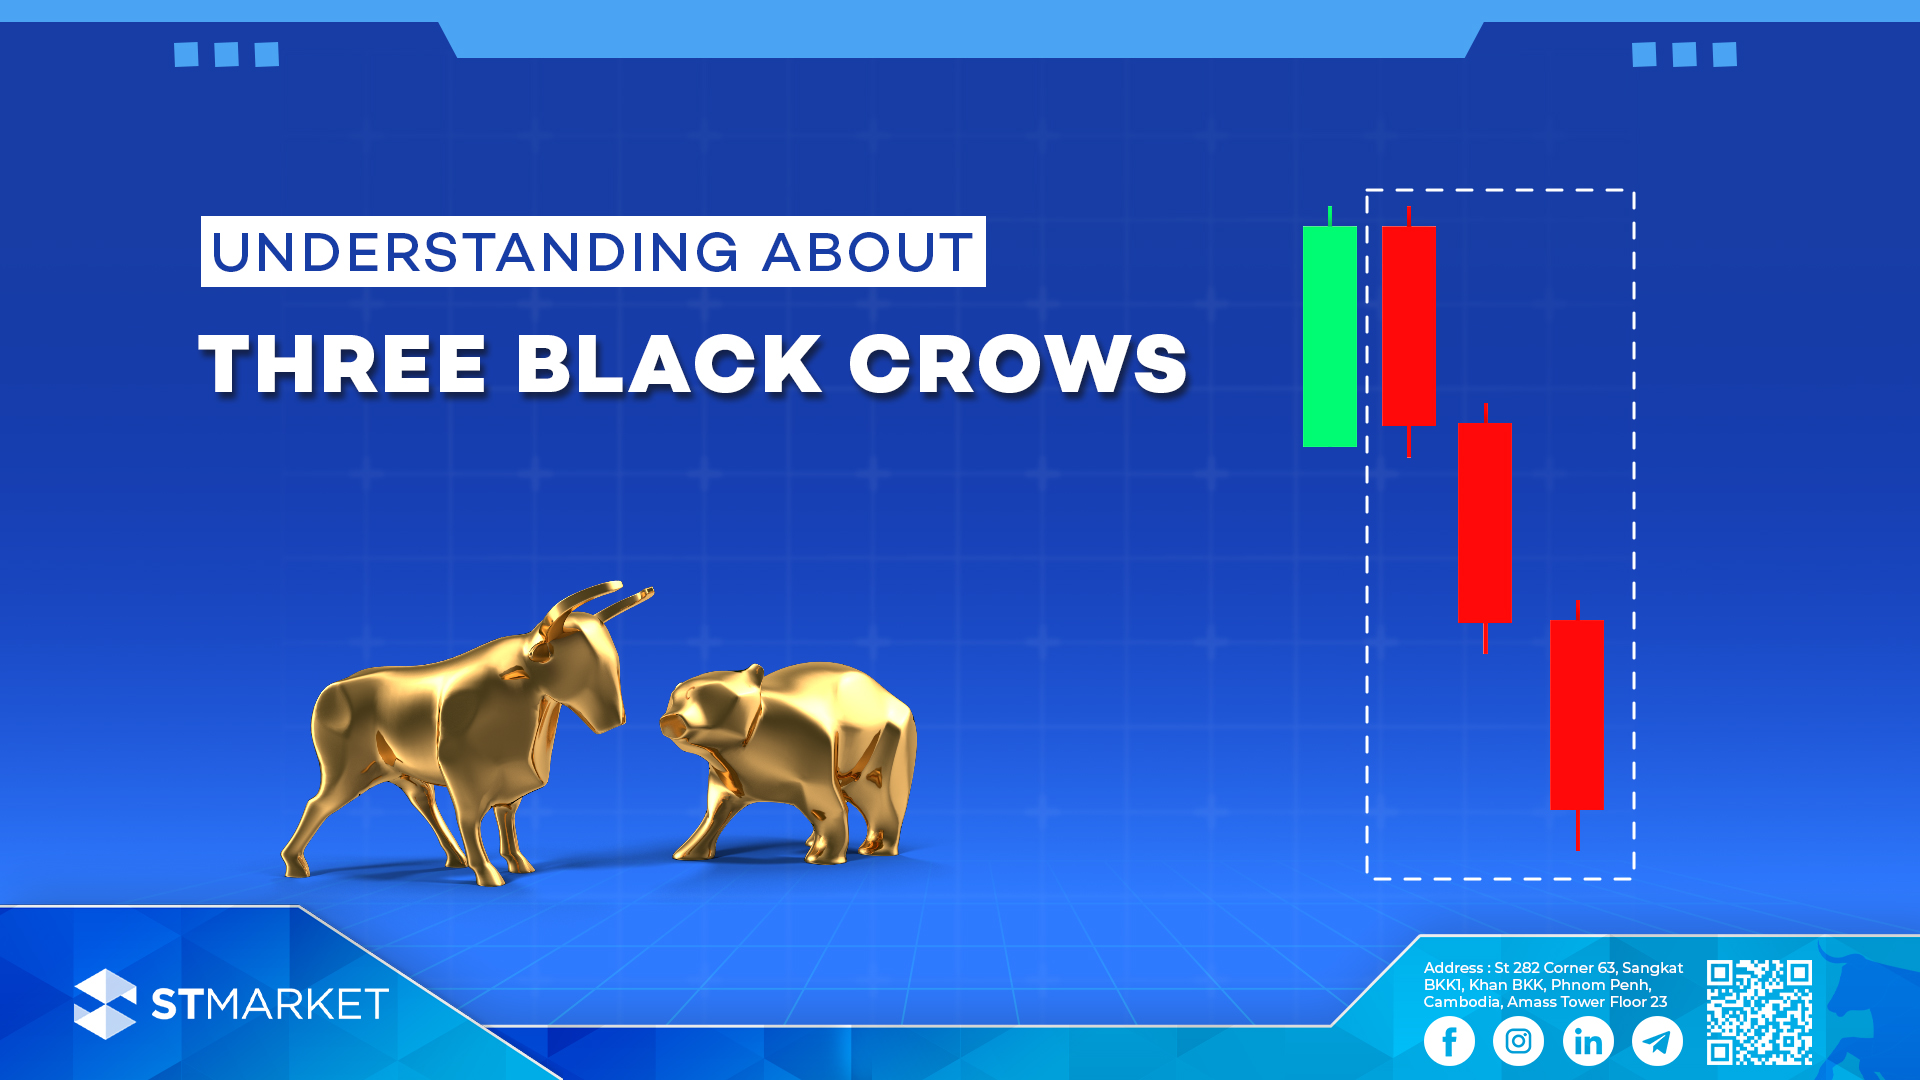
Understanding Three Black Crows Candlestick Patterns តើអ្វីទៅជា Three Black Crows Candlestick Pattern? និយមន័យ Three Black Crows candlestick pattern គឺជាប្រភេទទានដែលបង្ហាញពីសញ្ញាវិលពីលំហូរឡើងមកលំហូរចុះវិញ ដែលជាសញ្ញាបង្ហាញពីលំហូរចុះនឹងកើតឡើងនៅពេលខាងមុខ។ រូបរាង លក្ខណៈសម្គាល់ Three Black Crows candlestick patternគឺជាប្រភេទទាន៣រួមគ្នាដែលតែងតែលេចឡើងបន្ទាប់ពីលំហូរចុះ។លក្ខណៈសម្គាល់គឺទានទាំង៣ជាទានឡើងជាប់ៗគ្នាដែលបិទផ្សារនៅតម្លៃទាបជាងមុនជានិច្ច។ វាកើតឡើងនៅខាងចុងនៃលំហូរឡើង។ ឩទាហរណ៍ ទានឡើងដំបូងមុនពេល Three Black Crows កើតឡើងបានបង្ហាញពីអារម្មណ៍វិជ្ជមានចំពោះអ្នកវិនិយោគ ទោះយ៉ាងណាក៏ដោយនៅពេលដែលការលេចចេញឡើងនៃទានចុះចំនួនបីជាប់ៗគ្នាដែលទាបជាងមុនជានិច្ចបានផ្តល់សញ្ញាប្រាប់ថាអ្នកលក់អាចនឹងកំពុងចូលមកគ្រប់គ្រង។ ទម្រង់នេះប្រាប់យើងថាអាចនឹងមានការប្តូរទិសមកពីលំហូរឡើងទៅជាលំហូរចុះវិញ។ យោងតាមការសិក្សាក្រោមចំណងជើងថា“An Analysis of Candlestick Patterns in Market Forecasting” ធ្វើឡើងដោយក្រុមស្រាវជ្រាវនៅឯទស្សនាវត្តីTechnical Analysis of Stocks & Commodities (TASC) បង្ហាញថា ទម្រង់ទានThree Black Crows មានអត្រាជោគជ័យរហូតដល់ទៅ78% ក្នុងការព្យាករណ៍ថានឹងមានការប្តូរទិសមកចុះវិញ។ English Version What is a Three Black Crows candlestick Pattern? Definition Three Black Crows candlestick pattern is a bearish reversal candlestick pattern that typically forms after an uptrend. It signals that a potential bearish trend is forming and that the price may start to falls. Appearance Characteristics Three Black Crows candlestick pattern is a three candlestick formation that usually appears after an uptrend. It consists of three consecutive bearish candlestick pattern with lower closes. It is formed at the end of an uptrend. Example The initial bullish rally preceding the Three Black Crows pattern sparks optimism among investors; however, the appearance of three consecutive bearish candles with progressively lower lows signals that bears may be taking control. This pattern suggests a possible reversal of the prevailing uptrend. According to the study “An Analysis of Candlestick Patterns in Market Forecasting” by the research team at Technical Analysis of Stocks & Commodities (TASC) magazine, the Three Black Crows pattern has about a 78% success rate in forecasting bearish reversals.